[TOC]
0x00 前言简述 在计算机性能调试领域里 profiling 是指对应用程序的画像,画像就是应用程序使用 CPU 和内存的情况。
Go语言是一个对性能特别看重的语言,所以其自带了 profiling 的库,本章将主要讲解怎么在 golang 中做 profiling。
Go语言项目中的性能优化主要有以下几个方面:CPU profile:报告程序的 CPU 使用情况,按照一定频率去采集应用程序在 CPU 和寄存器上面的数据。Memory Profile(Heap Profile):报告程序的内存使用情况。Block Profiling:报告 goroutines 不在运行状态的情况,可以用来分析和查找死锁等性能瓶颈。Goroutine Profiling:报告 goroutines 的使用情况,以及 goroutine调用关系。
Q: 那如何进行程序性能数据的采集?
runtime/pprof:采集工具型应用运行数据进行分析net/http/pprof:采集服务型应用运行时数据进行分析
Tips: 当pprof被引用开启后,每隔一段时间(10ms)就会收集下当前的堆栈信息,获取各个函数占用的CPU以及内存资源;最后通过对这些采样数据进行分析,形成一个性能分析报告。
Tips: 通常在我们进行性能测试时会与基准测试联用,找出程序最需要优化的点,【非常注意】我们只在进行性能测试的时候才在代码中引入pprof。
0x01 性能调试工具实践 1.工具型应用 描述: 如果你的应用程序是运行一段时间就结束退出类型。那么最好的办法是在应用退出的时候把 profiling 的报告保存到文件中,进行分析。对于这种情况可以使用runtime/pprof库。
首先在你测试的代码中导入runtime/pprof工具: import "runtime/pprof", 其主要包含了CPU 和 内存等性能分析。
CPU性能分析: 它会在应用执行结束后生成一个文件,保存了程序执行过程中的 CPU profiling 数据, 得到采样数据之后,我们可以使用go tool pprof工具进行CPU性能分析。
[TOC]
0x00 前言简述 在计算机性能调试领域里 profiling 是指对应用程序的画像,画像就是应用程序使用 CPU 和内存的情况。
Go语言是一个对性能特别看重的语言,所以其自带了 profiling 的库,本章将主要讲解怎么在 golang 中做 profiling。
Go语言项目中的性能优化主要有以下几个方面:CPU profile:报告程序的 CPU 使用情况,按照一定频率去采集应用程序在 CPU 和寄存器上面的数据。Memory Profile(Heap Profile):报告程序的内存使用情况。Block Profiling:报告 goroutines 不在运行状态的情况,可以用来分析和查找死锁等性能瓶颈。Goroutine Profiling:报告 goroutines 的使用情况,以及 goroutine调用关系。
Q: 那如何进行程序性能数据的采集?
runtime/pprof:采集工具型应用运行数据进行分析net/http/pprof:采集服务型应用运行时数据进行分析
Tips: 当pprof被引用开启后,每隔一段时间(10ms)就会收集下当前的堆栈信息,获取各个函数占用的CPU以及内存资源;最后通过对这些采样数据进行分析,形成一个性能分析报告。
Tips: 通常在我们进行性能测试时会与基准测试联用,找出程序最需要优化的点,【非常注意】我们只在进行性能测试的时候才在代码中引入pprof。
0x01 性能调试工具实践 1.工具型应用 描述: 如果你的应用程序是运行一段时间就结束退出类型。那么最好的办法是在应用退出的时候把 profiling 的报告保存到文件中,进行分析。对于这种情况可以使用runtime/pprof库。
首先在你测试的代码中导入runtime/pprof工具: import "runtime/pprof", 其主要包含了CPU 和 内存等性能分析。
CPU性能分析: 它会在应用执行结束后生成一个文件,保存了程序执行过程中的 CPU profiling 数据, 得到采样数据之后,我们可以使用go tool pprof工具进行CPU性能分析。1 2 3 4 5 pprof.StartCPUProfile(w io.Writer) pprof.StopCPUProfile()
内存性能优化 得到采样数据之后,使用go tool pprof工具进行内存性能分析。1 2 pprof.WriteHeapProfile(w io.Writer)
Tips: 默认它是使用-inuse_space进行统计,还可以使用-inuse-objects查看分配对象的数量。
2.服务型应用 描述: 如果你的应用程序是一直运行的,比如 web 应用,那么可以使用net/http/pprof库,它能够在提供 HTTP 服务进行分析。
首先,你需要在web server端代码中按如下方式导入net/http/pprof, 例如 import _ "net/http/pprof", 它表示只加载init方法而不是使用其的方法。
如果你的Web Server使用了默认的 http.DefaultServeMux 通常是代码直接使用 `http.ListenAndServe(“0.0.0.0:8000”, nil) , 按照上述要求导入即可。
如果你使用自定义的 Mux,则需要手动注册一些路由规则:1 2 3 4 5 6 r.HandleFunc("/debug/pprof/" , pprof.Index) r.HandleFunc("/debug/pprof/cmdline" , pprof.Cmdline) r.HandleFunc("/debug/pprof/profile" , pprof.Profile) r.HandleFunc("/debug/pprof/symbol" , pprof.Symbol) r.HandleFunc("/debug/pprof/trace" , pprof.Trace)
如果你使用的是gin框架,那么推荐使用github.com/gin-contrib/pprof,在代码中通过以下命令注册pprof相关路由: pprof.Register(router)
Tips: 总之,不管是那种方式,你的 HTTP 服务都拥有/debug/pprof endpoint,访问它会得到Server端程序相关的Allocs、Goroutine以及Heap等信息:
/debug/pprof/profile:CPU profiling的路径,访问此链接会持续记录 30s并生成一个文件供下载。/debug/pprof/heap: Memory Profiling 的路径,访问这个链接会得到一个内存 Profiling 结果的文件。/debug/pprof/block:block Profiling 的路径/debug/pprof/goroutines:记录运行的 goroutines 列表,以及调用关系。
3.pprof 命令语法 描述: 不管是工具型应用还是服务型应用,我们使用相应的pprof库获取数据之后,下一步的都要对这些数据进行分析,我们可以使用go tool pprof命令行工具。
go tool pprof 最简单的使用方式为 go tool pprof [binary] [source] ,其中
binary 是应用的二进制文件,用来解析各种符号;
source 表示 profile 数据的来源,可以是本地的文件,也可以是 http 地址。
Tips: 非常注意获取的 Profiling 数据是动态的,要想获得有效的数据,请保证应用处于较大的负载(比如正在生成中运行的服务,或者通过其他工具模拟访问压力)。如果应用处于空闲状态,得到的结果可能没有任何意义。
pprof与性能测试结合 CPU 和 Memory profiling 保存的文件:
-cpuprofile:cpu profiling 数据要保存的文件地址
-memprofile:memory profiling 数据要报文的文件地址
比如下面执行测试的同时,也会执行 CPU profiling,并把结果保存在 cpu.prof 文件中:go test -bench . -cpuprofile=cpu.prof
比如下面执行测试的同时,也会执行 Mem profiling,并把结果保存在 cpu.prof 文件中:go test -bench . -memprofile=./mem.prof
Tips: 特别注意Profiling 一般和性能测试一起使用,在前文我们也提到过,只有应用在负载高的情况下 Profiling 才有意义。
实践案例: 1 2 3 4 5 6 7 8 9 10 11 12 13 14 15 16 17 18 19 20 21 22 23 24 25 26 ➜ go test -bench . -cpuprofile=cpu.prof ➜ go tool pprof cpu.prof
4.简单示例 示例1.首先我们来写一段有问题的代码 1 2 3 4 5 6 7 8 9 10 11 12 13 14 15 16 17 18 19 20 21 22 23 24 25 26 27 28 29 30 31 32 33 34 35 36 37 38 39 40 41 42 43 44 45 46 47 48 49 50 51 52 53 54 55 56 57 58 59 60 61 62 63 64 65 66 67 68 69 package mainimport ( "flag" "fmt" "os" "runtime/pprof" "time" ) func logicCode () var c chan int for { select { case v := <-c: fmt.Printf("recv from chan, value:%v\n" , v) default : } } } func main () var ( isCPUPprof, isMemPprof bool ) flag.BoolVar(&isCPUPprof, "cpu" , false , "turn cpu pprof on" ) flag.BoolVar(&isMemPprof, "mem" , false , "turn mem pprof on" ) flag.Parse() if isCPUPprof { f1, err := os.Create("./cpu.pprof" ) if err != nil { fmt.Printf("create cpu pprof failed, err:%v\n" , err) return } pprof.StartCPUProfile(f1) defer func () pprof.StopCPUProfile() f1.Close() }() } for i := 0 ; i < 8 ; i++ { go logicCode() } time.Sleep(20 * time.Second) if isMemPprof { f2, err := os.Create("./mem.pprof" ) if err != nil { fmt.Printf("create mem pprof failed, err:%v\n" , err) return } pprof.WriteHeapProfile(f2) f2.Close() } }
编译执行:1 2 3 4 ➜ pporftest go build ➜ pporftest ./pporftest -cpu true ➜ pporftest ls cpu.pprof main.go pporftest
当执行pporftest程序生成cpu.pprof文件后,我们可以通过下面的两种方式进行查看分析结果。
第一种,是使用go工具链里的pprof来进入交互界面查看分析结果。
第二种,是使用graphviz图形化工具,通过svg图的方式查看程序中详细的CPU占用情况
命令行交互界面 1 2 3 4 5 6 7 8 9 10 11 12 13 14 15 16 17 18 19 20 21 22 23 24 25 26 27 28 29 30 31 32 33 34 35 36 37 38 39 $ go tool pprof cpu.pprof File: pporftest Type: cpu Time: Nov 27, 2021 at 2:14pm (CST) Duration: 20.17s, Total samples = 57.72s (286.19%) Entering interactive mode (type "help" for commands, "o" for options) (pprof) top Showing nodes accounting for 57.71s, 100% of 57.72s total Dropped 5 nodes (cum <= 0.29s) flat flat% sum% cum cum% 22.36s 38.74% 38.74% 41.66s 72.18% runtime.selectnbrecv 19.30s 33.44% 72.18% 19.30s 33.44% runtime.chanrecv 16.05s 27.81% 100% 57.71s 100% main.logicCode (pprof) list logicCode Total: 57.72s ROUTINE ======================== main.logicCode in /home/weiyigeek/app/program/project/go/src/weiyigeek.top/studygo/Day08/07perfomance/pporftest/main.go 16.05s 57.71s (flat, cum) 100% of Total . . 12:// logicCode 函数中包含一段有问题的代码 . . 13:func logicCode . . 14: var c chan int // 未对通道c进行初始化 . . 15: for { . . 16: select { 16.05s 57.71s 17: case v := <-c: // 此时处于阻塞的状态 . . 18: fmt.Printf("recv from chan, value:%v\n" , v) . . 19: default: . . 20: . . 21: } . . 22: }
Tips: 在大多数的情况下,我们可以通过分析上面五列(关键指标)得出一个应用程序的运行情况,并对程序进行优化。
总结:通过上面的结果分析发现大部分CPU资源被17行占用,我们分析出select语句中的default没有内容会导致上面的case v:=<-c:一直执行, 我们在default分支添加一行time.Sleep(time.Second)即可, 此时我们再次查看分析结果:1 2 3 4 5 6 ➜ go build ➜ ./pporftest -cpu true ➜ go tool pprof cpu.pprof (pprof) top Showing nodes accounting for 0, 0% of 0 total flat flat% sum% cum cum%
graphviz 可视化图形工具 https://graphviz.gitlab.io/ 1 2 3 4 5 6 7 8 9 10 11 12 13 14 15 16 17 18 19 20 21 22 23 24 25 26 27 28 ➜ sudo apt install graphviz brew install graphviz ➜ dot -version dot - graphviz version 2.43.0 (0) libdir = "/usr/lib/x86_64-linux-gnu/graphviz" Activated plugin library: libgvplugin_dot_layout.so.6 Using layout: dot:dot_layout Activated plugin library: libgvplugin_core.so.6 Using render: dot:core Using device: dot:dot:core The plugin configuration file: /usr/lib/x86_64-linux-gnu/graphviz/config6a was successfully loaded. render : cairo dot dot_json fig gd json json0 map mp pic pov ps svg tk visio vml vrml xdot xdot_json layout : circo dot fdp neato nop nop1 nop2 osage patchwork sfdp twopi textlayout : textlayout device : canon cmap cmapx cmapx_np dot dot_json eps fig gd gd2 gif gv imap imap_np ismap jpe jpeg jpg json json0 mp pdf pic plain plain-ext png pov ps ps2 svg svgz tk vdx vml vmlz vrml wbmp webp x11 xdot xdot1.2 xdot1.4 xdot_json xlib loadimage : (lib) eps gd gd2 gif jpe jpeg jpg png ps svg webp xbm ➜ go build && ./pporftest -cpu true && go tool pprof cpu.pprof File: pporftest Type: cpu (pprof) gif Generating report in profile001.gif
weiyigeek.top-graphviz可视化性能占比查看
补充说明: 除了分析CPU性能数据,pprof也支持分析内存性能数据.1 2 3 4 5 6 go tool pprof -inuse_space http://127.0.0.1:8080/debug/pprof/heap go tool pprof -inuse_objects http://127.0.0.1:8080/debug/pprof/heap go tool pprof -alloc_space http://127.0.0.1:8080/debug/pprof/heap go tool pprof -alloc_objects http://127.0.0.1:8080/debug/pprof/heap
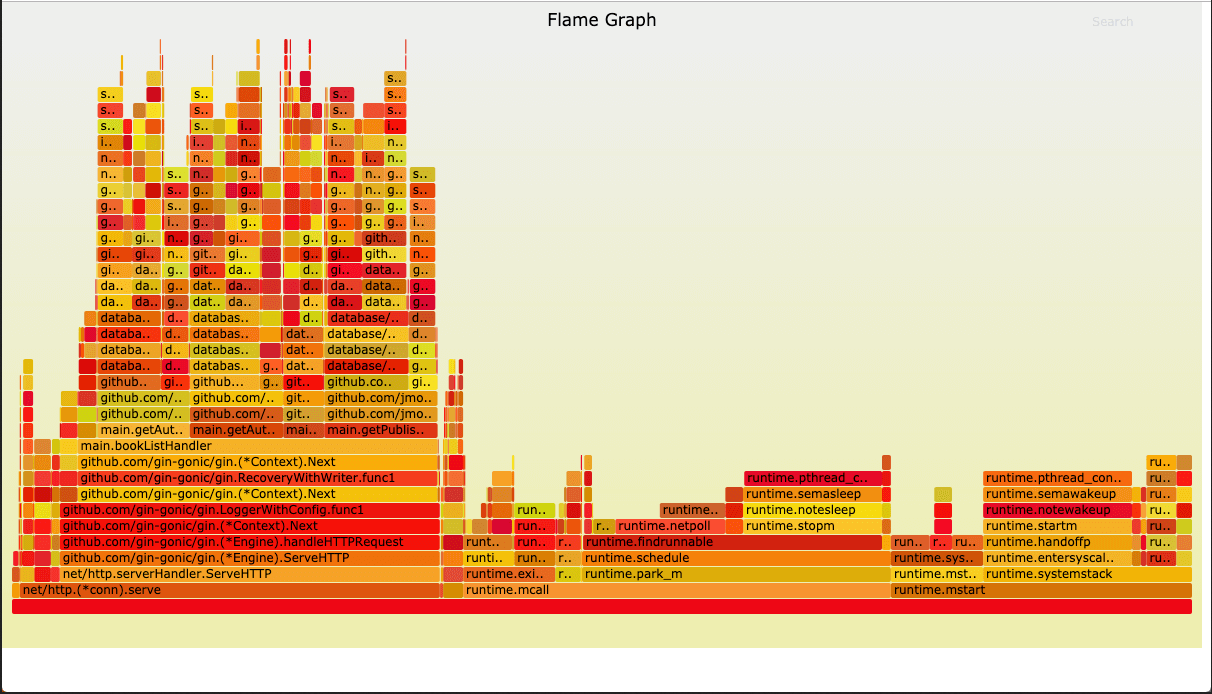
0x02 第三方性能调试工具实践 1.Go-torch 描述: 火焰图(Flame Graph)是 Bredan Gregg 创建的一种性能分析图表,因为它的样子近似 🔥 而得名;go-torch,它 是 uber 开源的一个工具,可以直接读取 golang profiling 数据,并生成一个火焰图的 svg 文件。
火焰图 svg 文件可以通过浏览器打开,它对于调用图的最优点是它是动态的,我们可以通过点击每个方块来 zoom in 分析它上面的内容。
火焰图的调用顺序从下到上,每个方块代表一个函数,它上面一层表示这个函数会调用哪些函数,方块的大小代表了占用 CPU 使用的长短。
Tips: 火焰图的配色并没有特殊的意义,默认的红、黄配色是为了更像火焰而已。
环境安装: 1 2 3 4 5 6 7 8 9 10 go get -v github.com/uber/go-torch git clone https://github.com/brendangregg/FlameGraph.git go install
工具参数浅析: 1 2 3 4 5 go-torch 格式与参数: go-torch -u http://localhost:8080 -s /debug/pprof/profile –seconds 30
工具使用实践: 1 2 3 4 5 6 7 8 9 10 11 12 13 14 https://github.com/adjust/go-wrk go-wrk -n 50000 http://127.0.0.1:8080/book/list go-torch -u http://127.0.0.1:8080 -t 30 go-torch -inuse_space http://127.0.0.1:8080/debug/pprof/heap go-torch -inuse_objects http://127.0.0.1:8080/debug/pprof/heap go-torch -alloc_space http://127.0.0.1:8080/debug/pprof/heap go-torch -alloc_objects http://127.0.0.1:8080/debug/pprof/heap
然后我们使用浏览器打开torch.svg就能看到如下火焰图了。
Q: 如分析 Flame Graph 火焰图?
描述: 火焰图的y轴表示cpu调用方法的先后,x轴表示在每个采样调用时间内方法所占的时间百分比,越宽代表占据cpu时间越多。
2.Go-wrk 压测工具 压测工具 wrk 后面使用到再介绍 推荐使用 https://github.com/wg/wrk 或 https://github.com/adjust/go-wrk.