[TOC]


0x00 组件介绍

Prometheus

描述: 如果我们采用prometheus提供的二进制可执行文件进行搭建prometheus服务器,可以按照以下流程进行操作运行,二进制Release下载地址: https://github.com/prometheus/prometheus/releases

简单流程:

1
2
3
4
5
6
7
8
9
10
11
12
13
14
15
16
17
18
19
20
21
22
23
24
25
26
27
28
29
30
31
32
33
34
35
36
37
38
39
40
41
# (1) 下载二进制可执行文件
wget https://github.com/prometheus/prometheus/releases/download/v2.26.0/prometheus-2.26.0.linux-amd64.tar.gz
tar -zxvf prometheus-2.26.0.linux-amd64.tar.gz -C /usr/local/
cd /usr/local/prometheus-2.26.0.linux-amd64

# (2) 后台启动并修改开放端口
nohup ./prometheus --config.file=prometheus.yml --web.enable-lifecycle --web.listen-address=:30090 &

# (3) 查看启动状态
ps -ef | grep prometheus
lsof -i:19908

# (4) 查看启动的命令行参数
./prometheus -h

# (5) 强行关闭 Prometheus
lsof -i:19908
kill -9 pid

# (6) 补充系统服务进行启动Prometheus
sudo tee /usr/lib/systemd/system/prometheus.service <<'EOF'
[Unit]
Description=Prometheus Server Systemd
Documentation=https://prometheus.io
After=network.target

[Service]
Type=simple
StandardError=journal
ExecStart=/usr/local/prometheus/prometheus --config.file=/usr/local/prometheus/prometheus.yml --web.listen-address=:9090 --storage.tsdb.path=/app/prometheus_data --storage.tsdb.retention.time=7d --web.enable-lifecycle --web.enable-admin-api
Restart=on-failure
RestartSec=3s

[Install]
WantedBy=multi-user.target
EOF

sudo systemctl daemon-reload && systemctl restart prometheus.service

# (7) 自动发现日志文件配置
mkdir /etc/prometheus/ && touch /etc/prometheus/WeiyiGeek_linux_nodes.yml

启动参数: 运行后我们可以访问http://192.168.12.107:30090/classic/flags查看到自定义或者默认的启动参数。

Command-Line Flags - 参数名称 参数值 参数说明
alertmanager.notification-queue-capacity 10000
alertmanager.timeout
config.file /etc/prometheus/prometheus.yml 指定 prometheus.yml配置文件
enable-feature
log.format logfmt 设置打印日志的格式,若有自动化日志提取工具可以使用这个参数规范日志打印的格式logger:stderr
log.level info
query.lookback-delta 5m
query.max-concurrency 20
query.max-samples 50000000
query.timeout 2m
rules.alert.for-grace-period 10m
rules.alert.for-outage-tolerance 1h
rules.alert.resend-delay 1m
scrape.adjust-timestamps true
storage.exemplars.exemplars-limit 0
storage.remote.flush-deadline 1m
storage.remote.read-concurrent-limit 10
storage.remote.read-max-bytes-in-frame 1048576
storage.remote.read-sample-limit 50000000
storage.tsdb.allow-overlapping-blocks false
storage.tsdb.max-block-duration 1d12h
storage.tsdb.min-block-duration 2h
storage.tsdb.no-lockfile false 如果用k8s的deployment 管理要设置为tue
storage.tsdb.path data/ 指定tsdb数据存储路径(容器中默认是/prometheus/data)
storage.tsdb.retention 0s
storage.tsdb.retention.size 0B [EXPERIMENTAL]要保留的最大存储块字节数,最旧的数据将首先被删除默认为0或禁用。
storage.tsdb.retention.time 0s 指定数据存储时间即何时删除旧数据(推荐7d)
storage.tsdb.wal-compression true 启用压缩预写日志(WAL),根据您的数据您可以预期WAL大小将减少一半而额外的CPU负载却很少
storage.tsdb.wal-segment-size 0B
web.config.file
web.console.libraries console_libraries
web.console.templates consoles
web.cors.origin .*
web.enable-admin-api false 是否启用 admin api 的访问权限(TSDB管理API)
web.enable-lifecycle true 是否启用 API,启用API后,可以通过 API指令完成 Prometheus 的 停止、热加载配置文件 等
web.external-url
web.listen-address 0.0.0.0:9090 监听地址和提供服务端口
web.max-connections 512
web.page-title Prometheus Time Series Collection and Processing Server
web.read-timeout 5m
web.route-prefix /
web.user-assets

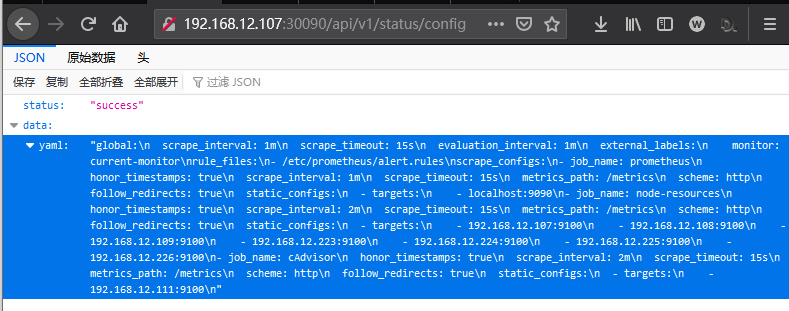
Tips : 当我们启用了 API 时我们可以使用它来看当前prometheus.yml中的配置和利用POST请求重载配置。

1
2
3
4
5
6
7
8
9
# 查看当前配置,如果使修改后的prometheus.yml配置生效可参照下面得方式(在也不用重启容器了)
curl http://192.168.12.107:30090/api/v1/status/config

# 方式1.如果在本机二进制可执行时可以通过使用SIGHUP来重载Prometheus而不用重启(ctrl+c)
kill -SIGHUP prometheus
# 方式2.Yes, sending SIGHUP to the Prometheus process or an HTTP POST request to the /-/reload endpoint
curl -X POST http://192.168.12.107:30090/-/reload
# level=info ts=2021-05-08T06:37:53.793Z caller=main.go:944 msg="Loading configuration file" filename=/etc/prometheus/prometheus.yml
# level=info ts=2021-05-08T06:37:53.799Z caller=main.go:975 msg="Completed loading of configuration file" filename=/etc/prometheus/prometheus.yml totalDuration=6.025725ms remote_storage=2.732µs web_handler=617ns query_engine=1.456µs scrape=124.866µs scrape_sd=55.119µs notify=1.099µs notify_sd=1.377µs rules=4.424043ms

WeiyiGeek.status-config

WeiyiGeek.status-config


Exporter&Collectors

描述: Prometheus 给我们提供了多种场景的监控程序,我们可以通过https://github.com/prometheus?q=_export&type=&language=&sort=Prometheus Gitlab项目中查看到。

  • (0) node_export : Node 主要监控主机硬件和系统资源相关指标,建议Windows用户使用Windows exporter。
    项目地址: https://github.com/prometheus/node_exporter
    1
    2
    3
    4
    5
    6
    7
    8
    9
    10
    11
    12
    13
    14
    15
    16
    17
    18
    19
    20
    21
    22
    23
    # 默认端口: 9100
    # Docker
    docker run -d --net="host" --pid="host" -v "/:/host:ro,rslave" quay.io/prometheus/node-exporter:latest --path.rootfs=/host

    # Docker compose
    ---
    version: '3.8'
    services:
    node_exporter:
    image: prom/node-exporter:latest
    container_name: node_exporter
    command:
    - '--path.rootfs=/host'
    network_mode: host
    pid: host
    restart: unless-stopped
    volumes:
    - '/:/host:ro,rslave'
    # Using the binary execute file
    # Auth 与 SSL 配置参考: https://github.com/prometheus/exporter-toolkit/blob/v0.1.0/https/README.md
    ./node_exporter --web.config="web-config.yml"

    # 在某些系统上,timex收集器需要一个附加的Docker标志-cap-add=SYS_TIME,以便访问所需的系统调用。

补充:Linux配置Systemd服务启动

1
2
3
4
5
6
7
8
9
10
11
12
13
14
15
16
17
18
19
20
21
22
23
24
25
26
27
28
29
30
31
ftp -v -n 192.168.12.31<<EOF
user WeiyiGeektemp
binary
lcd /tmp
prompt
get node_exporter-1.1.2.linux-amd64.tar.gz
bye
EOF
echo "download from ftp successfully"
sudo tar -zxvf /tmp/node_exporter-1.1.2.linux-amd64.tar.gz -C /usr/local/
sudo ln -s /usr/local/node_exporter-1.1.2.linux-amd64/node_exporter /usr/local/bin/node_exporter
sudo tee /usr/lib/systemd/system/node_exporter.service <<'EOF'
[Unit]
Description=Node Exporter Clinet
Documentation=https://prometheus.io/
After=network.target

[Service]
Type=simple
StandardError=journal
ExecStart=/usr/local/bin/node_exporter --web.listen-address=:9100
Restart=on-failure
RestartSec=3s

[Install]
WantedBy=multi-user.target
EOF
sudo chmod 754 /usr/lib/systemd/system/node_exporter.service
sudo systemctl daemon-reload
sudo systemctl enable node_exporter.service
sudo systemctl start node_exporter.service


  • (1) windows_exporter : 该采集器主要针对于Windows的机器。
    项目地址: https://github.com/prometheus-community/windows_exporter
    1
    2
    3
    4
    5
    6
    7
    8
    9
    10
    11
    12
    13
    14
    15
    16
    17
    18
    19
    20
    21
    22
    23
    24
    25
    26
    27
    # 默认端口: 9182
    # Usage
    # - 仅启用service collector并指定自定义查询
    .\windows_exporter.exe --collectors.enabled "service" --collector.service.services-where "Name='windows_exporter'"
    # - 仅启用process collector并指定自定义查询
    .\windows_exporter.exe --collectors.enabled "process" --collector.process.whitelist="firefox.+"
    # - 将[defaults]与--collectors.enabled参数一起使用,该参数将与所有默认收集器一起展开。
    .\windows_exporter.exe --collectors.enabled "[defaults],process,container"

    # Using a configuration file
    .\windows_exporter.exe --config.file=config.yml
    $config = """
    collectors:
    enabled: cpu,cs,logical_disk,net,os,system,service,logon,process,tcp
    collector:
    service:
    services-where: Name='windows_exporter'
    log:
    level: error
    scrape:
    timeout-margin: 0.5
    telemetry:
    addr: ":9182"
    path: /metrics
    max-requests: 5
    """
    echo $config > config.yml

补充: 采用PowerShell和bat添加自启动服务和设置防火墙放行。

1
2
3
4
5
6
7
8
9
10
11
12
13
14
15
16
17
18
19
20
21
22
23
24
25
26
27
28
29
30
31
32
33
34
35
36
37
38
39
40
41
42
43
44
45
46
47
48
49
50
51
52
53
54
55
# - PowerShell
#####################################
# Prometheus Metrics Nodes Services #
# Prometheus Exporter firewall Rule #
# Author: WeiyiGeek #
# Desc: 需要将该脚本以及windows_exporter-${exporterVersion}-amd64.exe文件放入到d:\pro中
#####################################

$exporterVersion="0.16.0"
$currentPath=(Get-Location).path
$serviceName="prometheus_exporter_service"
@"
collectors:
enabled: cpu,cs,logical_disk,net,os,system,service,logon,process,tcp
collector:
service:
services-where: Name='windows_exporter'
log:
level: error
scrape:
timeout-margin: 0.5
telemetry:
addr: ":9100"
path: /metrics
max-requests: 5
"@ | Out-File config.yml -Encoding utf8

# 如果服务存在则停止以及删除旧服务
if (Get-Service -Name ${serviceName} -ErrorAction Ignore )
{
echo "注意: 操作时需要关闭系统中全部services.msc服务窗口"
sc stop ${serviceName}
sc delete ${serviceName}
}

# - 服务创建
$params = @{
Name = ${serviceName}
BinaryPathName = "$currentPath\windows_exporter-${exporterVersion}-amd64.exe --config.file=$currentPath\config.yml"
DisplayName = "prometheus_windows_exporter_service"
StartupType = "Automatic"
Description = "windows exporter service open 9100 port!"
}
New-Service @params

# - 启动及服务查看
Get-Service -Name "prometheus_windows_exporter_service" | Start-Service -PassThru

# - 防火墙规则设置(只允许10.0.30.200机器访问)
New-NetFirewallRule -Name "prometheus_windows_exporter_service" -DisplayName "prometheus_windows_exporter_service" -Description "prometheus_windows_exporter_service" -Direction Inbound -LocalPort 9100 -RemoteAddress 10.0.30.200 -Protocol TCP -Action Allow -Enabled True
Get-NetFirewallRule -Name "prometheus_windows_exporter_service" | Format-Table
# - bat
sc create prometheus_windows_exporter_service binPath= "d:\weiyigeek\windows_exporter-0.16.0-amd64.exe --config.file=d:\weiyigeek\config.yml" start= "auto" displayname= "prometheus_windows_exporter_service"
sc start prometheus_windows_exporter_service
netsh advfirewall firewall add rule name="prometheus_windows_exporter_service" dir=in protocol=tcp localport=9100 action=allow remoteip=10.0.30.2 enable=yes


补充:采用msi格式进行安装部署

1
msiexec /i "D:\weiyigeek\windoes_exporter.msi" ENABELD_COLLECTORS="os,cpu,cs.logical_disk,net,system,process" LISTEN_PORT="9182" EXTRA_FLAGS="--collector.process.whitelist=abc|windows_exporter"


  • (2) blackbox_exporter : Blackbox 允许通过HTTP、HTTPS、DNS、TCP和ICMP对端点进行黑盒探测(其支持TLS和基本身份验证)。
    项目地址: https://github.com/prometheus/blackbox_exporter
    1
    2
    3
    4
    5
    6
    7
    8
    9
    10
    11
    12
    13
    14
    15
    16
    17
    18
    19
    20
    21
    22
    23
    24
    25
    26
    # 默认端口: 9115
    # Using the docker image
    docker run --rm -d -p 9115:9115 --name blackbox_exporter -v `pwd`:/config prom/blackbox-exporter:master --config.file=/config/blackbox.yml

    # Checking the results
    curl http://localhost:9115/probe?target=google.com&module=http_2xx

    # Prometheus Configuration
    # 黑盒导出器需要作为参数传递给目标,这可以通过重新标记来完成。
    scrape_configs:
    - job_name: 'blackbox'
    metrics_path: /probe
    params:
    module: [http_2xx] # Look for a HTTP 200 response.
    static_configs:
    - targets:
    - http://prometheus.io # Target to probe with http.
    - https://prometheus.io # Target to probe with https.
    - http://example.com:8080 # Target to probe with http on port 8080.
    relabel_configs:
    - source_labels: [__address__]
    target_label: __param_target
    - source_labels: [__param_target]
    target_label: instance
    - target_label: __address__
    replacement: 127.0.0.1:9115 # The blackbox exporter's real hostname:port.


  • (3) statsd_exporter: 该采集器接收StatsD样式的指标,并将其导出为Prometheus指标。
    项目地址: https://github.com/prometheus/statsd_exporter
    1
    2
    3
    4
    5
    6
    # 默认端口: 9125
    # Using Docker
    docker pull prom/statsd-exporter
    docker run -d -p 9102:9102 -p 9125:9125 -p 9125:9125/udp \
    -v $PWD/statsd_mapping.yml:/tmp/statsd_mapping.yml \
    prom/statsd-exporter --statsd.mapping-config=/tmp/statsd_mapping.yml
    Tips : 使用或者不使用 StatsD
    1
    2
    3
    4
    5
    6
    7
    # - 使用 StatsD : 要将指标从现有的StatsD环境导入Prometheus,请配置StatsD的转发器后端,以将所有接收到的指标重复到statsd_exporter 流程中。
    # 该导出器通过配置的映射规则将StatsD指标转换为Prometheus指标。
    +----------+ +-------------------+ +--------------+
    | StatsD |---(UDP/TCP repeater)--->| statsd_exporter |<---(scrape /metrics)---| Prometheus |
    +----------+ +-------------------+ +--------------+
    # - 没有StatsD :由于StatsD导出器使用与StatsD本身相同的线路协议,因此您还可以配置应用程序以将StatsD指标直接发送到导出器。在这种情况下,您不再需要运行StatsD服务器。
    # 我们建议仅将此作为中间解决方案,并建议长期使用本机Prometheus仪器。


  • (4) snmp_exporter : 建议使用此导出器以Prometheus可以提取的格式公开SNMP数据,尽管SNMP使用分层数据结构,而Prometheus使用n维矩阵,所以两个系统可以完美地映射而无需手工遍历数据 ;
    项目地址: https://github.com/prometheus/snmp_exporter
    1
    2
    3
    4
    5
    6
    7
    8
    9
    10
    11
    12
    13
    14
    15
    16
    17
    18
    19
    20
    21
    22
    23
    # 默认端口: 9116
    # Using : 二进制文件可以从Github发布页面下载不需要特殊安装。
    ./snmp_exporter
    # http://localhost:9116/snmp?target=1.2.3.4
    # http://localhost:9116/snmp?module=if_mib&target=1.2.3.4

    # Prometheus Configuration: 目标和模块可以通过重新标记作为参数传递。
    scrape_configs:
    - job_name: 'snmp'
    static_configs:
    - targets:
    - 192.168.1.2 # SNMP device.
    - switch.local # SNMP device.
    metrics_path: /snmp
    params:
    module: [if_mib]
    relabel_configs:
    - source_labels: [__address__]
    target_label: __param_target
    - source_labels: [__param_target]
    target_label: instance
    - target_label: __address__
    replacement: 127.0.0.1:9116 # The SNMP exporter's real hostname:port.

Tips : SNMP OID Tree 构成说明, SNMP由OID树构成,由MIB描述,OID子树在树中的不同位置具有相同的顺序。

1
2
3
4
# 数字是OID,括号中的名称是MIB的名称
1.3.6.1.2.1.2.2.1.1 (ifIndex)
1.3.6.1.2.1.2.2.1.2 (ifDescr)
1.3.6.1.2.1.31.1.1.1.10 (ifHCOutOctets)

Tips: Prometheus能够将SNMP索引实例映射到标签。例如ifEntry指定的INDEX ifIndex。这成为ifIndexPrometheus中的标签。


  • (5) consul_exporter : 该采集器支持外接配置中心,将领事服务运行状况导出到Prometheus。
    项目地址: https://github.com/prometheus/consul_exporter
    1
    2
    3
    4
    5
    6
    7
    8
    9
    # 默认端口: 9107
    # - Using Source
    make
    ./consul_exporter [flags]
    # - Using Docker
    docker pull prom/consul-exporter
    docker run -d -p 9107:9107 prom/consul-exporter --consul.server=172.17.0.1:8500
    # 如果您的容器需要能够与Consul服务器或代理进行通信。使用可从容器访问的IP或设置命令的--dns和--dns-search选项docker run 命令
    docker run -d -p 9107:9107 --dns=172.17.0.1 --dns-search=service.consul prom/consul-exporter --consul.server=consul:8500


  • (6) DCGM-Exporter : 该采集器主要针对于 NVIDIA GPU 相关的指标进行采集工具。
    此存储库包含Golang绑定和DCGM导出器,用于在Kubernetes中收集GPU遥测数据。项目地址:https://github.com/NVIDIA/gpu-monitoring-tools#dcgm-exporter
    1
    2
    3
    4
    5
    6
    7
    8
    9
    10
    11
    12
    13
    14
    15
    16
    17
    18
    19
    20
    # 默认端口: 9400
    # Usage
    # - Quickstart:要在GPU节点上收集指标,只需启动dcgm exporter容器:
    $ docker run -d --gpus all --rm -p 9400:9400 nvcr.io/nvidia/k8s/dcgm-exporter:2.0.13-2.1.2-ubuntu18.04
    $ curl localhost:9400/metrics
    # - Quickstart on Kubernetes : 考虑使用 NVIDIA GPU Operator 而不是直接使用DCGM导出器。
    $ helm repo add gpu-helm-charts \
    https://nvidia.github.io/gpu-monitoring-tools/helm-charts
    $ helm repo update
    $ helm install --generate-name gpu-helm-charts/dcgm-exporter
    $ kubectl create -f https://raw.githubusercontent.com/NVIDIA/gpu-monitoring-tools/master/dcgm-exporter.yaml
    $ NAME=$(kubectl get pods -l "app.kubernetes.io/name=dcgm-exporter" -o "jsonpath={ .items[0].metadata.name}")
    $ kubectl port-forward $NAME 8080:9400 &
    # - Building from Source
    $ git clone https://github.com/NVIDIA/gpu-monitoring-tools.git
    $ cd gpu-monitoring-tools
    $ make binary
    $ sudo make install
    $ dcgm-exporter &
    $ curl localhost:9400/metrics


  • (7) mysqld_exporter : Prometheus exporter for MySQL服务器度量,支持版本说明MySQL >= 5.6MariaDB >= 10.2
    项目地址: https://github.com/prometheus/mysqld_exporter
    注意:MySQL/MariaDB<5.6并不支持所有的收集方法
1
2
3
4
5
6
7
8
9
10
11
12
13
14
15
16
17
18
19
20
# 默认端口: 9104
# Required Grants
CREATE USER 'exporter'@'localhost' IDENTIFIED BY 'XXXXXXXX' WITH MAX_USER_CONNECTIONS 3;
GRANT PROCESS, REPLICATION CLIENT, SELECT ON *.* TO 'exporter'@'localhost';

# Using Binary
export DATA_SOURCE_NAME='user:password@(hostname:3306)/'
./mysqld_exporter <flags>
# <General flags> 参考地址 : https://github.com/prometheus/mysqld_exporter#general-flags
# Example format for flags for version > 0.10.0:
# --collect.auto_increment.columns
# --no-collect.auto_increment.columns

# Using Docker
docker network create my-mysql-network
docker pull prom/mysqld-exporter
docker run -d -p 9104:9104
--network my-mysql-network \
-e DATA_SOURCE_NAME="user:password@(hostname:3306)/" \
prom/mysqld-exporter

补充说明:

1
2
3
4
5
6
7
8
9
10
11
12
13
14
15
16
17
18
19
20
21
22
23
24
25
26
27
28
29
30
31
# - mysqld_exporter参数配置文件
sudo tee /etc/mysqld_exporter.cnf'EOF'
[client]
user=mysql_exporter
password=123456
EOF

# - 将mysqld_exporter作为系统服务进行启动。
sudo tee /usr/lib/systemd/system/mysqld_exporter.service <<'EOF'
[Unit]
Description=MySQL exporter Clinet
Documentation=https://github.com/prometheus/mysqld_exporter
After=network.target

[Service]
Type=simple
StandardError=journal
ExecStart=/usr/local/bin/mysqld_exporter --config.my-cnf=/etc/mysqld_exporter.cnf
Restart=on-failure
RestartSec=3s

[Install]
WantedBy=multi-user.target
EOF

chmod 754 /usr/lib/systemd/system/mysqld_exporter.service

systemctl daemon-reload && systemctl enable mysqld_exporter.service && systemctl start mysqld_exporter.service && systemctl status mysqld_exporter
systemctl daemon-reload && systemctl restart mysqld_exporter.service && systemctl status mysqld_exporter

systemctl status mysqld_exporter


  • (8) memcached_exporter : 该导出器主要针对于 memcached 内存数据库。
    项目地址:https://github.com/prometheus/memcached_exporter
    1
    2
    3
    4
    5
    6
    # 默认端口: 9150
    # Using source
    make
    ./memcached_exporter
    # Using Docker
    docker run -p 9150:9150 quay.io/prometheus/memcached-exporter:latest


  • (9) influxdb_exporter : 从0.9.0开始使用的InfluxDB格式指标的导出器。它通过HTTP API收集在线协议中的指标, 对其进行转换并将其公开以供Prometheus使用。此导出器支持float,int和boolean字段。标签将转换为Prometheus标签。
    默认情况下导出器还会监听UDP套接字(端口9122),在该套接字上使用/metrics端点公开influxDB指标,并在端点上公开导出程序的自我指标/metrics/exporter
    项目地址: https://github.com/prometheus/influxdb_exporter
    1
    2
    3
    4
    5
    6
    7
    8
    9
    10
    11
    12
    13
    14
    15
    16
    17
    18
    # 默认端口: 9122
    # Using
    # influxdb_exporter显示为普通的InfluxDB服务器。
    # 例如要与Telegraf一起使用,请将以下内容放入您的中
    [[outputs.influxdb]]
    urls = ["http://localhost:9122"]
    # 或者如果您想使用UDP:
    [[outputs.influxdb]]
    urls = ["udp://localhost:9122"]

    # example
    # 默认情况下,公开的指标没有原始时间戳
    http_requests_total{method="post",code="200"} 1027
    http_requests_total{method="post",code="400"} 3

    # 使用标志 --timestamps 将原始时间戳添加到公开的指标中
    http_requests_total{method="post",code="200"} 1027 1395066363000
    http_requests_total{method="post",code="400"} 3 1395066363000

Tips : 请注意Telegraf已经支持通过HTTP通过HTTP输出Prometheus度量标准 outputs.prometheus_client,从而避免了也必须运行influxdb_exporter。
Tips : 如果多次提交或多次采集了该指标,则只会存储最后一个值和时间戳。


  • (10) graphite_exporter : Graphite纯文本协议中导出的度量标准的导出器。它通过TCP和UDP接收数据,并进行转换并将其公开以供Prometheus使用。此导出器对于从现有Graphite设置导出度量标准以及核心Prometheus导出器(例如Node Exporter)未涵盖的度量很有用(即脚本自定义收集参数值反馈)。
    项目地址: https://github.com/prometheus/graphite_exporter
    1
    2
    3
    4
    5
    6
    7
    8
    9
    10
    11
    12
    13
    14
    15
    16
    17
    # 默认端口: 9108 / 9109 (Tcp|Udp)
    # Using Docker
    docker pull prom/graphite-exporter
    docker run -d -p 9108:9108 -p 9109:9109 -p 9109:9109/udp \
    -v ${PWD}/graphite_mapping.conf:/tmp/graphite_mapping.conf \
    prom/graphite-exporter --graphite.mapping-config=/tmp/graphite_mapping.confsing Docker

    # Usage
    make
    ./graphite_exporter
    # 配置现有监视以将Graphite纯文本数据发送到UDP或TCP上的端口9109,作为一个简单的演示:
    echo "test_tcp 1234 $(date +%s)" | nc localhost 9109
    echo "test_udp 1234 $(date +%s)" | nc -u -w1 localhost 9109
    # 为避免使用无限制的内存,指标将在最后一次推送到五分钟后进行垃圾回收,可通过`--graphite.sample-expiry`设置;

    # 结果验证:
    http://localhost:9108/metrics


  • (11) collectd_exporter : 它接受collected的网络插件发送的collected的 二进制网络协议 , 并通过collected的write_http插件发送的HTTP POST接受JSON格式的JSON格式的 度量,并将其转换并公开以供Prometheus使用。该导出器对于从现有收集的设置中导出度量标准以及核心Prometheus导出器(如Node Exporter)未涵盖的度量很有用。
    描述: https://github.com/prometheus/collectd_exporter
1
2
3
4
5
6
7
8
9
10
11
12
13
14
15
16
17
18
19
20
# 默认端口: 9103 、25826(UDP)
# Using Docker
docker pull prom/collectd-exporter
docker run -d -p 9103:9103 -p 25826:25826/udp prom/collectd-exporter --collectd.listen-address=":25826"

# Binary network protocol
LoadPlugin network
<Plugin network>
Server "prometheus.example.com" "25826"
</Plugin>

# JSON format (值得学习)
LoadPlugin write_http
<Plugin write_http>
<Node "collectd_exporter">
URL "http://localhost:9103/collectd-post"
Format "JSON"
StoreRates false
</Node>
</Plugin>


  • (12) haproxy_exporter : 简单的服务器,它可以抓取HAProxy数据并通过HTTP将它们导出,供Prometheus使用。注意:自HAProxy 2.0.0起,官方资源包括Prometheus导出器模块,该模块可在构建期间通过单个标志内置到二进制文件中,并提供无导出器的Prometheus端点。
    1
    2
    3
    4
    5
    6
    7
    8
    9
    10
    11
    12
    13
    14
    # 默认端口: 9101
    # Using Binary
    ./haproxy_exporter [flags]
    # Using Socket : 作为localhost HTTP的替代方法,可以使用stats套接字。在HAProxy中启用stats套接字,例如:
    stats socket /run/haproxy/admin.sock mode 660 level admin
    haproxy_exporter --haproxy.scrape-uri=unix:/run/haproxy/admin.sock
    # Using Docker
    docker run -p 9101:9101 quay.io/prometheus/haproxy-exporter:v0.12.0 --haproxy.scrape-uri="http://user:pass@haproxy.example.com/haproxy?stats;csv"

    # Usage : HTTP统计URL
    haproxy_exporter --haproxy.scrape-uri="http://localhost:5000/baz?stats;csv"
    haproxy_exporter --haproxy.scrape-uri="http://haproxy.example.com/haproxy?stats;csv"
    haproxy_exporter --haproxy.scrape-uri="http://user:pass@haproxy.example.com/haproxy?stats;csv" # 带有认证
    haproxy_exporter --no-haproxy.ssl-verify --haproxy.scrape-uri="https://haproxy.example.com/haproxy?stats;csv"


  • (13) jmx_exporter : 该收集器可配置地抓取和公开JMX目标的mBean, 该导出程序旨在作为Java代理运行,公开HTTP服务器并提供本地JVM的度量。它也可以作为独立的HTTP服务器运行,并刮擦远程JMX目标,但这有许多缺点,例如难以配置并且无法公开过程指标(例如,内存和CPU使用率)。因此,强烈建议将导出程序作为Java代理运行。
    项目地址: https://github.com/prometheus/jmx_exporter
1
2
3
4
5
6
7
8
9
10
11
12
13
14
15
16
17
18
19
20
21
22
23
24
25
26
27
28
29
30
31
32
33
34
35
36
37
# 默认端口: 8080
java -javaagent:./jmx_prometheus_javaagent-0.15.0.jar=8080:config.yaml -jar yourJar.jar

# Using : To run as a javaagent download the jar and run:
java -javaagent:./jmx_prometheus_javaagent-0.15.0.jar=8080:config.yaml -jar yourJar.jar
# Configuration
---
startDelaySeconds: 0
hostPort: 127.0.0.1:1234
username:
password:
jmxUrl: service:jmx:rmi:///jndi/rmi://127.0.0.1:1234/jmxrmi
ssl: false
lowercaseOutputName: false
lowercaseOutputLabelNames: false
whitelistObjectNames: ["org.apache.cassandra.metrics:*"]
blacklistObjectNames: ["org.apache.cassandra.metrics:type=ColumnFamily,*"]
rules:
- pattern: 'org.apache.cassandra.metrics<type=(\w+), name=(\w+)><>Value: (\d+)'
name: cassandra_$1_$2
value: $3
valueFactor: 0.001
labels: {}
help: "Cassandra metric $1 $2"
cache: false
type: GAUGE
attrNameSnakeCase: false

# Test
curl http://localhost:8080/metrics

# run_sample_httpserver.sh
#!/usr/bin/env bash
# Script to run a java application for testing jmx4prometheus.
version=$(sed -n -e 's#.*<version>\(.*-SNAPSHOT\)</version>#\1#p' pom.xml)
# Note: You can use localhost:5556 instead of 5556 for configuring socket hostname.
java -Dcom.sun.management.jmxremote.ssl=false -Dcom.sun.management.jmxremote.authenticate=false -Dcom.sun.management.jmxremote.port=5555 -jar jmx_prometheus_httpserver/target/jmx_prometheus_httpserver-${version}-jar-with-dependencies.jar 5556 example_configs/httpserver_sample_config.yml


  • (13) exporter-toolkit : Prometheus出口商工具包(Go库), 该存储库旨在与client_golang存储库结合使用 。如果要检测现有的Go应用程序,则 client_golang是您要查找的存储库。

项目地址: https://github.com/prometheus/exporter-toolkit


  • (14) redis_exporter : Prometheus Redis 指标采集器支持版本Redis 2.x, 3.x, 4.x, 5.x, and 6.x

项目地址: https://github.com/oliver006/redis_exporter/
命令行参数参考: https://github.com/oliver006/redis_exporter/#command-line-flags

1
2
3
4
5
6
7
8
9
10
11
12
13
14
15
16
17
18
19
20
21
22
23
24
25
26
27
28
29
30
31
32
33
34
35
36
37
38
39
40
41
42
43
44
45
46
47
48
49
50
51
52
53
# Build && Run Binary
git clone https://github.com/oliver006/redis_exporter.git
cd redis_exporter
go build .
./redis_exporter --version

# Run Docker
docker run -d --name redis_exporter -p 9121:9121 -e REDIS_ADDR="redis://192.168.12.1doc85:6379" -e REDIS_PASSWORD="weiyigeek.top" oliver006/redis_exporter:alpine
docker run -d --name redis_exporter --network host -e REDIS_ADDR="redis://192.168.12.1doc85:6379" -e REDIS_PASSWORD="weiyigeek.top" oliver006/redis_exporter

# Kubernetes 部署配置示例
# k8s-redis-and-exporter-deployment.yaml
---
apiVersion: v1
kind: Namespace
metadata:
name: redis
---
apiVersion: apps/v1
kind: Deployment
metadata:
namespace: redis
name: redis
spec:
replicas: 1
selector:
matchLabels:
app: redis
template:
metadata:
annotations:
prometheus.io/scrape: "true"
prometheus.io/port: "9121"
labels:
app: redis
spec:
containers:
- name: redis
image: redis:4
resources:
requests:
cpu: 100m
memory: 100Mi
ports:
- containerPort: 6379
- name: redis-exporter
image: oliver006/redis_exporter:latest
resources:
requests:
cpu: 100m
memory: 100Mi
ports:
- containerPort: 9121

Configuration && 配置:

1
2
3
4
5
6
7
8
9
10
11
12
13
14
15
16
17
18
19
20
21
22
23
24
25
26
27
28
29
30
31
# 基本构型
scrape_configs:
- job_name: redis_exporter
static_configs:
- targets: ['localhost:9121']

# 配置刮多个Redis主机
# 使用命令行标志redis.addr=运行导出程序,这样它就不会在每次刮取/metrics端点时都尝试访问本地实例。
scrape_configs:
- job_name: 'redis_exporter_targets'
file_sd_configs:
- files:
- targets-redis-instances.yml
metrics_path: /scrape
relabel_configs:
- source_labels: [__address__]
target_label: __param_target
- source_labels: [__param_target]
target_label: instance
- target_label: __address__
replacement: <<REDIS-EXPORTER-HOSTNAME>>:9121

## config for scraping the exporter itself
- job_name: 'redis_exporter'
static_configs:
- targets:
- <<REDIS-EXPORTER-HOSTNAME>>:9121

# targets-redis-instances.yml
- targets: [ "redis://redis-host-01:6379", "redis://redis-host-02:6379" ]
"labels": { 'env': 'prod' }

补充说明:

1
2
3
4
5
6
7
8
9
10
11
12
13
14
15
16
cat > /usr/lib/systemd/system/redis_exporter.service << EOF
[Unit]
Description=redis_exporter
After=network.target
[Service]
Type=simple
ExecStart=/usr/local/redis_exporter-v1.20.0.linux-amd64/redis_exporter -redis.addr=IP:6379 -redis.password=passwd
Restart=on-failure
[Install]
WantedBy=multi-user.target
EOF

chmod 754 /usr/lib/systemd/system/redis_exporter.service
systemctl daemon-reload && systemctl enable redis_exporter .service && systemctl start redis_exporter .service && systemctl status redis_exporter
systemctl daemon-reload && systemctl restart redis_exporter .service && systemctl status redis_exporter
systemctl status redis_exporter


Alertmanager

描述: Alertmanager处理客户端应用程序(如Prometheus服务器)发送的警报。它负责重复数据消除、分组,并将它们路由到正确的接收器集成,如电子邮件、PagerDuty或OpsGenie,同时它还负责沉默和抑制警报。

项目地址: https://github.com/prometheus/alertmanager
文档帮助: http://prometheus.io/docs/alerting/alertmanager/


WeiyiGeek.Alertmanager-组件架构

WeiyiGeek.Alertmanager-组件架构


标签 在 Alertmanager 主要关键作用:

  • 1) 降噪: 发送更高级的告警从而忽略某些告警。
  • 2) 静音: 知道某个告警并且正在处理,无需再次报警,例如在Alertmanager中设置Silences静默。
  • 3) 路由: 使用多个路由树,将告警通过各种方式进行发送。
  • 4) 分组: 使得某一特征的标签实例发送一个通知。
  • 5) 抑制重复: 如果已经发送了警告可以设置报警间隔时间以达到抑制重复警告。
  • 6) 通知: 通过模板或者邮件、Webhook、企业微信进行发送通知。


简单流程:

1
2
3
4
5
6
7
8
9
10
11
12
13
14
15
16
17
18
19
20
21
22
23
24
25
26
27
28
29
30
31
32
33
34
35
# 默认端口: 9093

# Install
# - Docker images
$ docker run --name alertmanager -d -p 127.0.0.1:9093:9093 quay.io/prometheus/alertmanager
# - Compiling the binary
$ mkdir -p $GOPATH/src/github.com/prometheus
$ cd $GOPATH/src/github.com/prometheus
$ git clone https://github.com/prometheus/alertmanager.git
$ cd alertmanager
$ make build
$ ./alertmanager --config.file=<your_file>

# Usage
usage: alertmanager [<flags>]


# (6) 补充系统服务进行启动alertmanager
sudo tee /usr/lib/systemd/system/alertmanager.service <<'EOF'
[Unit]
Description=Prometheus Alertmanager Server Systemd
Documentation=https://prometheus.io
After=network.target

[Service]
Type=simple
StandardError=journal
ExecStart=/usr/local/alertmanager/alertmanager --config.file=/usr/local/alertmanager/alertmanager.yml --web.listen-address=:9093 --storage.path=/monitor/alertmanager/data
Restart=on-failure
RestartSec=3s

[Install]
WantedBy=multi-user.target
EOF
sudo systemctl daemon-reload && systemctl restart alertmanager.service


启动参数:

1
2
3
4
5
6
7
8
9
10
11
12
13
14
15
16
17
18
19
20
21
22
23
24
25
26
27
28
# 1 nobody    7:47 /bin/alertmanager --config.file=/etc/alertmanager.yaml --storage.path=/alertmanager
Flags:
--config.file="alertmanager.yml" Alertmanager configuration file name.
--storage.path="data/" Base path for data storage.
--data.retention=120h How long to keep data for.
--alerts.gc-interval=30m Interval between alert GC.
--web.external-url=WEB.EXTERNAL-URL The URL under which Alertmanager is externally reachable (for example, if Alertmanager is served via a reverse proxy). Used for generating relative and
absolute links back to Alertmanager itself. If the URL has a path portion, it will be used to prefix all HTTP endpoints served by Alertmanager. If omitted,
relevant URL components will be derived automatically.
--web.route-prefix=WEB.ROUTE-PREFIX Prefix for the internal routes of web endpoints. Defaults to path of --web.external-url.
--web.listen-address=":9093" Address to listen on for the web interface and API.
--web.get-concurrency=0 Maximum number of GET requests processed concurrently. If negative or zero, the limit is GOMAXPROC or 8, whichever is larger.
--web.timeout=0 Timeout for HTTP requests. If negative or zero, no timeout is set.
--cluster.listen-address="0.0.0.0:9094" Listen address for cluster. Set to empty string to disable HA mode.
--cluster.advertise-address=CLUSTER.ADVERTISE-ADDRESS Explicit address to advertise in cluster.
--cluster.peer=CLUSTER.PEER ... Initial peers (may be repeated).
--cluster.peer-timeout=15s Time to wait between peers to send notifications.
--cluster.gossip-interval=200ms Interval between sending gossip messages. By lowering this value (more frequent) gossip messages are propagated across the cluster more quickly at the expenseof increased bandwidth.
--cluster.pushpull-interval=1m0s Interval for gossip state syncs. Setting this interval lower (more frequent) will increase convergence speeds across larger clusters at the expense of ncreased bandwidth usage.
--cluster.tcp-timeout=10s Timeout for establishing a stream connection with a remote node for a full state sync, and for stream read and write operations.
--cluster.probe-timeout=500ms Timeout to wait for an ack from a probed node before assuming it is unhealthy. This should be set to 99-percentile of RTT (round-trip time) on your network.
--cluster.probe-interval=1s Interval between random node probes. Setting this lower (more frequent) will cause the cluster to detect failed nodes more quickly at the expense of increased bandwidth usage.
--cluster.settle-timeout=1m0s Maximum time to wait for cluster connections to settle before evaluating notifications.
--cluster.reconnect-interval=10s Interval between attempting to reconnect to lost peers.
--cluster.reconnect-timeout=6h0m0s Length of time to attempt to reconnect to a lost peer.
--log.level=info Only log messages with the given severity or above. One of: [debug, info, warn, error]
--log.format=logfmt Output format of log messages. One of: [logfmt, json]
--version Show application version.


Tips :amtool是用于与Alertmanager API交互的cli工具,它与Alertmanager的所有版本捆绑在一起。

1
2
3
4
5
6
7
8
9
10
11
12
13
14
15
16
17
18
19
20
21
22
23
24
25
26
27
28
29
30
31
32
# 1.Install
go get github.com/prometheus/alertmanager/cmd/amtool

# 2.Examples
# - 查看所有当前触发的警报:
$ amtool alert
Alertname Starts At Summary
Test_Alert 2017-08-02 18:30:18 UTC This is a testing alert!
Check_Foo_Fails 2017-08-02 18:30:18 UTC This is a testing alert!

# - 通过扩展输出查看所有当前触发的警报:
amtool -o extended alert
Labels Annotations Starts At Ends At Generator URL
alertname="Test_Alert" instance="node0" link="https://example.com" summary="This is a testing alert!" 2017-08-02 18:31:24 UTC 0001-01-01 00:00:00 UTC http://my.testing.script.local

# - 使用Alertmanager提供的丰富查询语法:
$ amtool -o extended alert query alertname="Test_Alert"
$ amtool -o extended alert query alertname=~"Test.*" instance=~".+1"

# - 暂停警报(Silence an alert)与查看静音的警报
$ amtool silence add alertname="Test_Alert" instance=~".+0"
$ amtool silence query
ID Matchers Ends At Created By Comment
b3ede22e-ca14-4aa0-932c-ca2f3445f926 alertname=Test_Alert 2017-08-02 19:54:50 UTC kellel
$ amtool silence query

# - 启动警报(也可以进行匹配启动)或者终止所有沉默
$ amtool silence expire b3ede22e-ca14-4aa0-932c-ca2f3445f926
$ amtool silence expire $(amtool silence -q query instance=~".+0")
$ amtool silence expire $(amtool silence query -q)


Pushgateway

描述: PushGateway 作为 Prometheus 生态中的一个重要一员,它允许任何客户端向其 Push 符合规范的自定义监控指标,并且可以允许临时任务和批处理作业向 Prometheus 公开其指标,再结合 Prometheus 统一收集监控。例如被采集的主机由于网络环境的限制无法直接到达Prometheus server,因此可以将其指标推送到 Pushgateway ,然后在由 Pushgateway 将这些指标公开给 Prometheus,其次是在监控业务数据的时候需要将不同数据汇总, 由 Prometheus 统一收集。
项目地址: https://github.com/prometheus/pushgateway


应用场景: Prometheus 采用定时 Pull 模式,可能由于子网络或者防火墙的原因,不能直接拉取各个 Target 的指标数据,此时可以采用各个 Target 往 PushGateway 上 Push 数据,然后 Prometheus 去 PushGateway 上定时 pull。其次在监控各个业务数据时,需要将各个不同的业务数据进行统一汇总,此时也可以采用 PushGateway 来统一收集,然后 Prometheus 来统一拉取。


Pushgateway 架构说明:

1
Batch Job - "Single push before exiting" -> Pushgateway <-  "Regular Scrapes - Prometheus


Pushgateway 安装配置说明:

1
2
3
4
5
6
7
8
9
10
11
12
13
14
15
16
17
18
19
20
21
22
23
24
# 默认端口:9091

# Using Docker
docker pull prom/pushgateway
docker run -d -p 9091:9091 prom/pushgateway

# 补充系统服务进行启动alertmanager
sudo tee /usr/lib/systemd/system/pushgateway.service <<'EOF'
[Unit]
Description=Prometheus pushgateway Server Systemd
Documentation=https://prometheus.io
After=network.target

[Service]
Type=simple
StandardError=journal
ExecStart=/usr/local/pushgateway/pushgateway --web.listen-address=:9091
Restart=on-failure
RestartSec=3s

[Install]
WantedBy=multi-user.target
EOF
sudo systemctl daemon-reload && systemctl restart pushgateway.service


Pushgateway 补充说明:

  • 1) 指标数据上传: 通过支持Prometheus的多种编程语言模块进行实现,例如Python中Prometheus_client中的push_to_gateway / pushadd_to_gateway / delete_from_gateway等函数,或者利用http请求进行上传例如linux中curl(后面实战部分会进行讲解)。
  • 2) 桥接: 因为测控和展示是独立的两件事,例如可以通过Go、python、Java客户端中Graphite桥接实现将指标输出数据转化为其他非Prometheus格式的数据,从而使得将指标转换为Graphite能够解读的格式数据输出。
  • 3) 解析器: 在客户端库注册表中访问到指标输出内容,以将Prometheus的指标数据输入到其他监控系统或者本地工具中,例如DataDog、InfluxDB、Sensu和Metricbeat该类系统由相应的组件可以解析这类脚本。
  • 4) 指标类型: 我们可以在Prometheus里的/metrics看到指标的HELP(对指标含义的描述)和TYPE(该指标的格式)。
    1
    2
    3
    # HELP promhttp_metric_handler_requests_in_flight Current number of scrapes being served.
    # TYPE promhttp_metric_handler_requests_in_flight gauge
    promhttp_metric_handler_requests_in_flight 1
  • 5) 指标标签: 为该指标打上标签并且标签的排序并不重要,但是前缀指标相同的指标建议放在一处之中,可确保Prometheus最佳的写入性能。
    1
    2
    3
    4
    prometheus_test_seconds_sum{label="bar",baz="qu"} 0
    prometheus_test_seconds_count{label="bar",baz="quu"} 1
    prometheus_test_seconds_sum{label="flar",baz="qu"} 2
    prometheus_test_seconds_count{label="flar",baz="quu"} 3
  • 6) 编码格式: 默认的上传指标中的HELP和标签值均实验完整的UTF-8编码,因此需要反斜杠来进行转义特殊字符,
    1
    2
    3
    4
    5
    # HELP : 下处是换行和反斜杠
    HELP escaping Test newline \\n and backslash \\ escaped
    TYPE escaping gauge
    # LABLE : 下处是换行符、反斜杠和双引号
    escaping{foo="newline \n backslash \\ double quote \" "} 1
  • 7) 时间戳: 在上传的指标数据中可以标明时间戳(以毫秒为单位的整数值,它自UNIX纪元之后算起),但是通常不要使用展示格式的时间戳,而是通过e指数来表示。
  • 8) 指标解析检查: 我们可以采用promtool进行检测我们上传到pushgateway中的指标数据的格式是否有效,所以通过上传的指标可以被抓取但并不意味该指标符合格式要求。
    1
    2
    3
    $ curl -s http://10.10.107.249:9091/metrics | promtool check metrics
    test_metric counter metrics should have "_total" suffix
    test_metric no help text


PushGateway 常用 RestFul 接口:
描述: 常用方法有POST/PUT以及DELETE格式为http://10.10.107.249:9091/metrics/job/{工作名称}/标签名称/标签内容,注意<工作名称>是job标签的值,后面跟任意数量的标签对,instance标签可以有也可以没有。

简单示例:

1
2
3
4
5
6
7
8
9
10
11
12
13
14
15
16
17
18
19
20
21
22
23
24
# - 1) Push a single sample(单个) into the group identified by {job="some_job"} 以及指定指标的参数标签:
echo "some_metric 3.14" | curl --data-binary @- http://10.10.107.249:9091/metrics/job/some_job
echo "some_metric 3.14" | curl --data-binary @- http://10.10.107.249:9091/metrics/job/some_job/labels/demo_test
# 输出结果
# # TYPE some_metric untyped # 注意这里的类型。
# some_metric{instance="",job="some_job",labels="demo_test"} 3.14

# - 2) Push something more complex (复杂多个) into the group identified by {job="some_job",instance="some_instance"}:
cat <<EOF | curl --data-binary @- http://10.10.107.249:9091/metrics/job/some_job/instance/some_instance
# TYPE some_metric counter
some_metric{label="val1"} 42
# TYPE another_metric gauge
# HELP another_metric Just an example.
another_metric 2398.283
EOF

# - 3) 删除由标识的组中的所有度量 {job="some_job",instance="some_instance"} :
curl -X DELETE http://10.10.107.249:9091/metrics/job/some_job/instance/some_instance

# - 4) 删除由标识的组中的所有指标{job="some_job"}(请注意{job="some_job",instance="some_instance"},即使这些指标具有相同的作业标签,该示例中也不包括该组中的指标):
curl -X DELETE http://10.10.107.249:9091/metrics/job/some_job

# - 5) 删除所有组中的所有指标(要求通过命令行标志启用admin API --web.enable-admin-api)
curl -X PUT http://10.10.107.249:9091/api/v1/admin/wipe
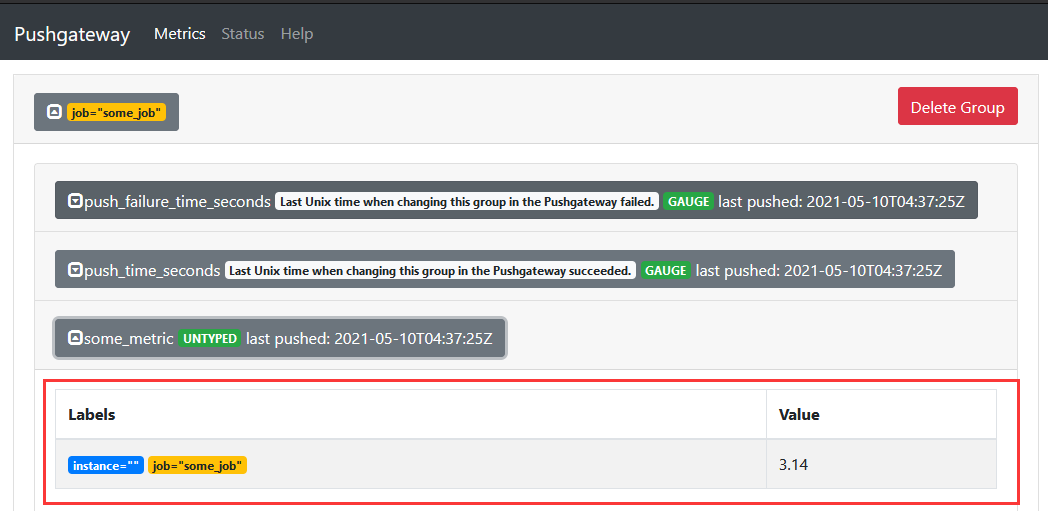
WeiyiGeek.利用CURL上传数据到pushgateway之中

WeiyiGeek.利用CURL上传数据到pushgateway之中

Tips : Pushgateway显然不是聚合器或分布式计数器而是指标缓存,适用于服务级别指标。

Tips : Pushgateway必须被配置为一个目标,由Prometheus使用一种常用的方法进行抓取。但是您应该始终在scrape config中设置honor_labels: true

Tips : 为了防止 pushgateway 重启或意外挂掉,导致数据丢失,可以通过 -persistence.file-persistence.interval 参数将数据持久化下来。

Tips : API所有的推送都是通过HTTP完成的界面有点像REST,例如:/metrics/job/<JOB_NAME>{/<LABEL_NAME>/<LABEL_VALUE>}, 参考地址:https://github.com/prometheus/pushgateway#api。


0x01 配置文件

Prometheus.yml

描述: 该配置文件为Prometheus的服务端配置文件,设置采集数据的主机以及采集器相关参数,在Prometheus启动时常常使用e --config.file 参数指定该配置文件的绝对路径。
帮助文档: https://prometheus.io/docs/prometheus/latest/configuration/configuration/

Tips : 该文件以YAML格式编写,由下面描述的方案定义。括号表示参数是可选的。对于非列表参数,该值设置为指定的默认值。
Configuration file 主要配置对象:

1
2
3
4
5
6
7
8
9
10
11
12
13
14
15
16
17
18
19
20
21
22
23
24
25
26
* <scrape_config>
* <tls_config>
* <azure_sd_config>
* <consul_sd_config>
* <digitalocean_sd_config>
* <dockerswarm_sd_config>
* <dns_sd_config>
* <ec2_sd_config>
* <openstack_sd_config>
* <file_sd_config>
* <gce_sd_config>
* <hetzner_sd_config>
* <kubernetes_sd_config>
* <marathon_sd_config>
* <nerve_sd_config>
* <serverset_sd_config>
* <triton_sd_config>
* <eureka_sd_config>
* <scaleway_sd_config>
* <static_config>
* <relabel_config>
* <metric_relabel_configs>
* <alert_relabel_configs>
* <alertmanager_config>
* <remote_write>
* <remote_read>

Tips : 通用占位符定义如下:

  • <boolean>: a boolean that can take the values true or false
  • <duration>: a duration matching the regular expression ((([0-9]+)y)?(([0-9]+)w)?(([0-9]+)d)?(([0-9]+)h)?(([0-9]+)m)?(([0-9]+)s)?(([0-9]+)ms)?|0), e.g. 1d, 1h30m, 5m, 10s
  • <filename>: a valid path in the current working directory
  • <host>: a valid string consisting of a hostname or IP followed by an optional port number
  • <int>: an integer value
  • <labelname>: a string matching the regular expression [a-zA-Z_][a-zA-Z0-9_]*
  • <labelvalue>: a string of unicode characters
  • <path>: a valid URL path
  • <scheme>: a string that can take the values http or https
  • <secret>: a regular string that is a secret, such as a password
  • <string>: a regular string
  • <tmpl_string>: a string which is template-expanded before usage


(1) 语法格式

1
2
3
4
5
6
7
8
9
10
11
12
13
14
15
16
17
18
19
20
21
22
23
24
25
26
27
28
29
30
31
32
33
34
35
36
37
38
39
40
41
42
43
44
45
46
47
48
49
50
51
52
53
54
55
56
57
58
59
60
61
62
63
64
65
66
67
68
69
70
71
72
73
74
75
76
77
78
79
80
81
82
83
84
85
86
87
88
89
90
91
92
93
94
95
96
97
98
99
100
101
102
103
104
105
106
107
108
109
110
111
112
113
114
115
116
117
118
119
120
121
122
123
124
125
126
127
128
129
130
131
132
133
134
135
136
137
138
139
140
141
142
143
144
145
146
147
148
149
150
151
152
153
154
155
156
157
158
159
160
161
162
163
164
165
166
167
168
169
170
171
172
173
174
175
176
177
178
179
180
181
182
183
184
185
186
187
188
189
190
191
192
193
194
195
196
197
198
199
200
201
202
203
204
205
206
207
208
209
# - 全局配置指定在所有其他配置上下文中有效的参数
global:
[ scrape_interval: <duration> | default = 1m ] # 默认情况下刮取目标的频率。
[ scrape_timeout: <duration> | default = 10s ] # 刮取请求超时的时间。
[ evaluation_interval: <duration> | default = 1m ] # 评估规则的频率。
external_labels: # 与任何时间序列或警报通信时要添加的标签,外部系统(联合、远程存储、Alertmanager)。
[ <labelname>: <labelvalue> ... ]
[ query_log_file: <string> ] # #PromQL查询记录到的文件,重新加载配置将重新打开文件。

# - 从所有匹配的文件中读取监控规则与警报规则。
rule_files:
[ - <filepath_glob> ... ]


#- 警报指定与Alertmanager相关的设置。
alerting:
alert_relabel_configs: # - 警报重新标记在发送到Alertmanager之前应用于警报,用途是确保一对具有不同外部标签的Prometheus服务器发送相同的警报。
alertmanagers:
[ timeout: <duration> | default = 10s ] # Per-target Alertmanager timeout when pushing alerts.
[ api_version: <string> | default = v2 ] # The api version of Alertmanager.
[ path_prefix: <path> | default = / ] # Prefix for the HTTP path alerts are pushed to.
[ scheme: <scheme> | default = http ] # Configures the protocol scheme used for requests.

# - 与远程写入功能相关的设置。将其应用到远程端点,写重新标记应用于外部标签之后还可限制发送的样本
remote_write:
[ name: <string> ] # 远程写入配置的名称,如果指定,则该名称在远程写入配置中必须是唯一的。
url: <string> # 要向其发送示例的终结点的URL。
[ remote_timeout: <duration> | default = 30s ]
headers: # 与每个远程写入请求一起发送的自定义HTTP头,主要自己设置的标题不能被覆盖。
[ <string>: <string> ... ]
write_relabel_configs: # #远程写重新标记配置的列表。
[ - <relabel_config> ... ]
queue_config: # 配置用于写入远程存储的队列。
# Number of samples to buffer per shard before we block reading of more
# samples from the WAL. It is recommended to have enough capacity in each
# shard to buffer several requests to keep throughput up while processing
# occasional slow remote requests.
[ capacity: <int> | default = 2500 ]
# Maximum number of shards, i.e. amount of concurrency.
[ max_shards: <int> | default = 200 ]
# Minimum number of shards, i.e. amount of concurrency.
[ min_shards: <int> | default = 1 ]
# Maximum number of samples per send.
[ max_samples_per_send: <int> | default = 500]
# Maximum time a sample will wait in buffer.
[ batch_send_deadline: <duration> | default = 5s ]
# Initial retry delay. Gets doubled for every retry.
[ min_backoff: <duration> | default = 30ms ]
# Maximum retry delay.
[ max_backoff: <duration> | default = 100ms ]
# Retry upon receiving a 429 status code from the remote-write storage.
# This is experimental and might change in the future.
[ retry_on_http_429: <boolean> | default = false ]

metadata_config: # 配置向远程存储发送序列元数据(随时可能更改或在将来的版本中删除。)
# Whether metric metadata is sent to remote storage or not.
[ send: <boolean> | default = true ]
# How frequently metric metadata is sent to remote storage.
[ send_interval: <duration> | default = 1m ]

# - 与远程读取功能相关的设置(键值对参数设置与上述基本一致)
remote_read:
[ - <remote_read> ... ]


# - 指定了一组目标和描述如何获取它们的参数(刮擦配置列表)。
scrape_configs:
[ - <scrape_config> ... ]
job_name: <job_name> # 采集对象的作业名称。
[ scrape_interval: <duration> | default = <global_config.scrape_interval> ] # job局部刮取目标的频率。
[ scrape_timeout: <duration> | default = <global_config.scrape_timeout> ] # job局部请求超时的时间。

# honor_labels 处理标签之间的冲突注意(“作业”和“实例”标签,手动配置的目标标签,以及由服务发现实现生成的标签)。
# 将pushu labels设置为“true”对于诸如联合和清除Pushgateway之类的用例非常有用,在这些用例中,应该保留在目标中指定的所有标签。
[ honor_labels: <boolean> | default = false ] # 如为true则保存冲突标签

# honor_timestamps 是否信任被刮取的数据上的时间戳。
[ honor_timestamps: <boolean> | default = true ] # 如果将timestamps设置为“true”,则将使用目标公开的度量的时间戳。

[ scheme: <scheme> | default = http ] # 目标拉取协议(https|http)
[ metrics_path: <path> | default = /metrics ] # 从目标获取度量的HTTP资源路径。
params: # (可选的)HTTP URL参数。
[ <string>: [<string>, ...] ]
authorization: # 使用配置的凭据在每个scrape请求上设置“Authorization”头。
# Sets the authentication type of the request.
[ type: <string> | default: Bearer ]
# Sets the credentials of the request. It is mutually exclusive with `credentials_file`.
[ credentials: <secret> ]
# Sets the credentials of the request with the credentials read from the configured file. It is mutually exclusive with `credentials`.
[ credentials_file: <filename> ]
basic_auth: # 使用配置的用户名和密码在每个scrape请求上设置“Authorization”头。
[ username: <string> ]
[ password: <secret> ] # 密码和密码文件是互斥的。
[ password_file: <string> ]

[ follow_redirects: <bool> | default = true ] # 配置刮取请求是否遵循HTTP 3xx重定向。

tls_config: # 请求站点的SSL证书(tls连接)设置
[ <tls_config> ]
[ ca_file: <filename> ] # 用于验证API服务器证书的CA证书。
[ cert_file: <filename> ] # 用于向服务器进行客户端证书身份验证的证书和密钥文件。
[ key_file: <filename> ]
[ server_name: <string> ] # 用于指示服务器的名称(https://tools.ietf.org/html/rfc4366#section-3.1)
[ insecure_skip_verify: <boolean> ] # 禁用服务器证书验证。


[ proxy_url: <string> ] # 代理设置

# - 设置多种服务发现方式(详情参考上面的URL),这里主要讲解最常用的file_sd_config和kubernetes_sd_configs配置
# 基于文件的服务发现提供了一种更通用的方法来配置静态目标,并充当插入自定义服务发现机制的接口(文件可以YAML或JSON格式提供,格式样例看下面的tips)。
file_sd_configs: #它读取一组包含零个或多个<static_config>列表的文件。
- files:
- my/path/tg_*.json
[ refresh_interval: <duration> | default = 5m ] # 该静态文件刷新时间间隔

# 基于kubernetes的服务发现,允许从 Kubernetes' REST API 拉取集群pod相关信息并时刻保持同步。
kubernetes_sd_configs:
[ api_server: <host> ]
role: <string> # One of endpoints, service, pod, node, or ingress.
namespaces: #可选命名空间发现。如果省略则使用所有名称空间。
names:
[ - <string> ]
# 可选的标签和字段选择器,用于将发现过程限制为可用资源的子集。
[ selectors:
[ - role: <string>
[ label: <string> ]
[ field: <string> ] ]]

# 用于向API服务器进行身份验证的可选身份验证信息。
tls_config: # tls 访问必须设置
[ <tls_config> ]
basic_auth:
[ username: <string> ]
[ password: <secret> ] | [ password_file: <string> ]
authorization:
# Sets the authentication type.
[ type: <string> | default: Bearer ] # 设置身份验证类型。
# 设置凭据。它与“凭证文件”互斥。
[ credentials: <secret> ] | [ credentials_file: <filename> ]

# ----------------------------------------------------------------------- #
# List of Azure service discovery configurations.
azure_sd_configs:
[ - <azure_sd_config> ... ]
# List of Consul service discovery configurations.
consul_sd_configs:
[ - <consul_sd_config> ... ]
# List of DigitalOcean service discovery configurations.
digitalocean_sd_configs:
[ - <digitalocean_sd_config> ... ]
# List of Docker Swarm service discovery configurations.
dockerswarm_sd_configs:
[ - <dockerswarm_sd_config> ... ]
# List of DNS service discovery configurations.
dns_sd_configs:
[ - <dns_sd_config> ... ]
# List of EC2 service discovery configurations.
ec2_sd_configs:
[ - <ec2_sd_config> ... ]
# List of Eureka service discovery configurations.
eureka_sd_configs:
[ - <eureka_sd_config> ... ]
# List of GCE service discovery configurations.
gce_sd_configs:
[ - <gce_sd_config> ... ]
# List of Hetzner service discovery configurations.
hetzner_sd_configs:
[ - <hetzner_sd_config> ... ]

# List of Marathon service discovery configurations.
marathon_sd_configs:
[ - <marathon_sd_config> ... ]
# List of AirBnB's Nerve service discovery configurations.
nerve_sd_configs:
[ - <nerve_sd_config> ... ]
# List of OpenStack service discovery configurations.
openstack_sd_configs:
[ - <openstack_sd_config> ... ]
# List of Scaleway service discovery configurations.
scaleway_sd_configs:
[ - <scaleway_sd_config> ... ]
# List of Zookeeper Serverset service discovery configurations.
serverset_sd_configs:
[ - <serverset_sd_config> ... ]
# List of Triton service discovery configurations.
triton_sd_configs:
[ - <triton_sd_config> ... ]


# - 在scrape配置中指定静态目标的规范方法,允许指定目标列表和它们的公共标签集
static_configs:
- targets: ['localhost:9090', 'localhost:9191']
labels:
[ <labelname>: <labelvalue> ... ]

# - 重新标记是一个强大的工具,可以在目标被刮除之前动态重写它的标签集(重点)
relabel_configs:
[ source_labels: '[' <labelname> [, ...] ']' ] # 源标签从现有标签中选择值
[ separator: <string> | default = ; ] # 源标签从现有标签中选择值
[ regex: <regex> | default = (.*);([^:].) ] # 与提取的值匹配的正则表达式。
[ modulus: <int> ] # 取源标签值散列的模数。
[ replacement: <string> | default = $1 ] # - 如果正则表达式匹配,则对其执行正则表达式替换的替换值。
[ action: <relabel_action> | default = replace ] # 基于正则表达式匹配执行的操作, 可选actions (replace, keep, drop, labelmap,labeldrop and labelkeep) 最后详细介绍。
[ target_label: <labelname> ] # 在替换操作中写入结果值的标签,对于替换操作是强制性的

metric_relabel_configs: # - 公制重新标记配置的列表,用途是排除成本太高而无法摄取的时间序列。

[ sample_limit: <int> | default = 0 ] # 每次刮取将被接受的刮取样品数量限制(0 means no limit)。
[ target_limit: <int> | default = 0 ] # 每个scrape配置将接受的唯一目标数限制(0 means no limit)。

Tips : 文件必须包含使用以下格式的静态配置列表;

1
2
JSON json [ { "targets": [ "<host>", ... ], "labels": { "<labelname>": "<labelvalue>", ... } }, ... ]
YAML yaml - targets: [ - '<host>' ] labels: [ <labelname>: <labelvalue> ... ]

Tips : 在 Prometheus监控kubernetes允许从以下role之一方式进行目标的发现;

  • node : 为每个群集节点发现一个目标,其地址默认为Kubelet的HTTP端口,地址类型顺序: NodeInternalIP, NodeExternalIP, NodeLegacyHostIP, and NodeHostName.

    1
    2
    3
    4
    5
    6
    7
    # Available meta labels: 此外instance节点的标签将设置为从API服务器检索到的节点名。
    __meta_kubernetes_node_name:节点对象的名称
    __meta_kubernetes_node_label_<labelname>:节点对象中的每个标签。
    __meta_kubernetes_node_labelpresent_<labelname> :是的对于节点对象中的每个标签。
    __meta_kubernetes_node_annotation_<annotationname>:来自节点对象的每个注释。
    __meta_kubernetes_node_annotationpresent_<annotationname> :是的对于节点对象中的每个注释。
    __meta_kubernetes_node_address_<address_type>:每个节点地址类型的第一个地址(如果存在)。
  • service : 为每个服务的每个服务端口发现一个目标。这对于服务的黑盒监视通常很有用。地址将设置为服务的Kubernetes DNS名称和相应的服务端口。

    1
    2
    3
    4
    5
    6
    7
    8
    9
    10
    11
    __meta_kubernetes_namespace:服务对象的命名空间。
    __meta_kubernetes_service_annotation_<annotationname>:来自服务对象的每个批注。
    __meta_kubernetes_service_annotationpresent_<annotationname>:“true”表示服务对象的每个注释。
    __meta_kubernetes_service_cluster_ip:服务的群集IP地址(不适用于ExternalName类型的服务)
    __meta_kubernetes_service_external_name:服务的DNS名称(适用于ExternalName类型的服务)
    __meta_kubernetes_service_label_<labelname>:来自服务对象的每个标签。
    __meta_kubernetes_service_labelpresent_<labelname> :是的对于服务对象的每个标签。
    __meta_kubernetes_service_name:服务对象的名称
    __meta_kubernetes_service_port_name:目标的服务端口的名称。
    __meta_kubernetes_service_port_protocol:目标的服务端口的协议。
    __meta_kubernetes_service_type:服务的类型
  • pod : 发现所有pod并将其容器作为目标公开。对于容器的每个声明端口,生成一个单独的目标。如果容器没有指定的端口,则为每个容器创建一个端口空闲目标,以便通过重新标记手动添加端口。

    1
    2
    3
    4
    5
    6
    7
    8
    9
    10
    11
    12
    13
    14
    15
    16
    17
    18
    19
    __meta_kubernetes_namespace:pod对象的命名空间。
    __meta_kubernetes_pod_name:pod对象的名称
    __meta_kubernetes_pod_ip:pod对象的pod IP。
    __meta_kubernetes_pod_label_<labelname>:pod对象中的每个标签。
    __meta_kubernetes_pod_labelpresent_<labelname> :是的对于pod对象中的每个标签。
    __meta_kubernetes_pod_annotation_<annotationname>:pod对象中的每个注释。
    __meta_kubernetes_pod_annotationpresent_<annotationname> :是的对于pod对象的每个注释。
    __meta_kubernetes_pod_container_init :是的如果容器是 初始化容器
    __meta_kubernetes_pod_container_name:目标地址指向的容器的名称。
    __meta_kubernetes_pod_container_port_name:容器端口的名称
    __meta_kubernetes_pod_container_port_number:集装箱端口号
    __meta_kubernetes_pod_container_port_protocol:集装箱港口的协议
    __meta_kubernetes_pod_ready:设置为是的或false吊舱准备就绪
    __meta_kubernetes_pod_phase:设置为悬而未决的 ,Running ,成功 ,Failed或未知在生命周期 .
    __meta_kubernetes_pod_node_name:pod被调度到的节点的名称。
    __meta_kubernetes_pod_host_ip:pod对象的当前主机IP。
    __meta_kubernetes_pod_uid:pod对象的UID。
    __meta_kubernetes_pod_controller_kind:pod控制器的对象类型。
    __meta_kubernetes_pod_controller_name:吊舱控制器的名称
  • endpoints : 从服务的列出的终结点发现目标。对于每个endpointaddress,每个端口都会发现一个目标。如果端点由一个pod支持,那么pod的所有附加容器端口(未绑定到端点端口)也会被发现作为目标。

    1
    2
    3
    4
    5
    6
    7
    8
    9
    10
    11
    12
    __meta_kubernetes_namespace:endpoints对象的命名空间。
    __meta_kubernetes_endpoints_name:endpoints对象的名称。
    对于直接从端点列表中发现的所有目标(未从底层POD中额外推断出的目标),将附加以下标签:
    __meta_kubernetes_endpoint_hostname:终结点的主机名
    __meta_kubernetes_endpoint_node_name:承载终结点的节点的名称。
    __meta_kubernetes_endpoint_ready:设置为是的或false对于端点的就绪状态
    __meta_kubernetes_endpoint_port_name:终结点端口的名称
    __meta_kubernetes_endpoint_port_protocol:终结点端口的协议
    __meta_kubernetes_endpoint_address_target_kind:终结点地址目标的类型。
    __meta_kubernetes_endpoint_address_target_name:终结点地址目标的名称。
    如果端点属于服务,则role: service发现已附加
    对于由吊舱支持的所有目标role: pod发现已附加
  • ingress : 为每个入口的每个路径发现一个目标。这通常对黑盒监控入口很有用地址将设置为入口规范中指定的主机。

    1
    2
    3
    4
    5
    6
    7
    8
    __meta_kubernetes_namespace:ingress对象的命名空间。
    __meta_kubernetes_ingress_name -入口对象的名称
    __meta_kubernetes_ingress_label_<labelname>:来自ingress对象的每个标签。
    __meta_kubernetes_ingress_labelpresent_<labelname> :是的对于ingress对象中的每个标签。
    __meta_kubernetes_ingress_annotation_<annotationname>:来自ingress对象的每个注释。
    __meta_kubernetes_ingress_annotationpresent_<annotationname> :是的对于ingress对象的每个注释。
    __meta_kubernetes_ingress_scheme:入口协议方案,https如果设置了TLSconfig。默认为http .
    __meta_kubernetes_ingress_path:从入口规范的路径默认为 / .

Tips : relabel_config 对象中<relabel_action>确定要执行的重新标记操作:

  • replace:匹配正则表达式针对串联的source_labels. 然后,集合目标_标签replacement,具有匹配组引用(${1} ,${2},…)在替换被它们的价值所取代。如果regex不匹配,不进行替换
  • keep为哪个目标删除正则表达式与连接的不匹配source_labels .
  • drop为哪个目标删除正则表达式匹配连接的source_labels .
  • hashmod:套目标_标签modulus 连接的源代码标签 .
  • labelmap:匹配正则表达式所有的标签名称,然后将匹配标签的值复制到replacement具有匹配组引用(${1} ,${2},…)在替换被它们的价值所取代
  • labeldrop:匹配正则表达式所有的标签名称。任何匹配的标签都将从标签集中删除。
  • labelkeep:匹配正则表达式所有的标签名称。任何不匹配的标签将从标签集中删除。

必须小心labeldroplabelkeep以确保一旦标签被移除,度量仍然是唯一的。


(2) 基础示例

  • 2.1) 基本常规监控 global config 的yaml文件示例
    1
    2
    3
    4
    5
    6
    7
    8
    9
    10
    11
    12
    13
    14
    15
    16
    17
    18
    19
    20
    21
    22
    23
    24
    25
    26
    27
    28
    29
    30
    31
    32
    33
    34
    35
    36
    37
    38
    39
    40
    41
    42
    43
    44
    45
    46
    47
    48
    49
    50
    51
    52
    53
    54
    55
    56
    57
    58
    59
    60
    61
    62
    63
    64
    65
    66
    67
    68
    69
    70
    71
    72
    73
    74
    75
    76
    77
    78
    79
    80
    81
    82
    83
    84
    85
    86
    87
    88
    89
    90
    91
    92
    93
    94
    95
    96
    97
    98
    99
    100
    101
    102
    103
    104
    105
    106
    107
    108
    109
    110
    111
    112
    113
    114
    115
    116
    117
    118
    119
    120
    121
    122
    123
    124
    125
    126
    127
    128
    129
    130
    131
    132
    133
    134
    135
    136
    137
    138
    139
    140
    141
    142
    143
    144
    145
    146
    147
    148
    149
    150
    151
    152
    153
    154
    155
    156
    157
    158
    159
    160
    161
    162
    163
    164
    165
    166
    167
    168
    169
    170
    171
    172
    173
    174
    175
    176
    177
    178
    179
    180
    181
    182
    183
    184
    185
    186
    187
    188
    189
    190
    191
    192
    193
    194
    195
    196
    197
    198
    199
    200
    201
    202
    203
    204
    205
    206
    207
    208
    209
    210
    211
    212
    213
    214
    215
    216
    217
    218
    219
    220
    221
    222
    223
    224
    225
    226
    227
    228
    229
    230
    231
    232
    233
    234
    235
    236
    237
    238
    239
    240
    241
    242
    243
    244
    245
    246
    247
    248
    249
    250
    251
    252
    253
    254
    255
    256
    257
    258
    259
    260
    261
    262
    263
    264
    265
    266
    267
    268
    269
    270
    271
    272
    273
    274
    275
    276
    277
    278
    279
    280
    281
    282
    283
    284
    285
    286
    287
    288
    289
    290
    291
    292
    293
    294
    295
    296
    297
    298
    299
    300
    301
    302
    303
    304
    305
    306
    307
    308
    309
    310
    311
    312
    313
    314
    # - 全局配置
    global:
    scrape_interval: 60s
    scrape_timeout: 10s
    evaluation_interval: 30s
    external_labels:
    monitor: codelab
    foo: bar

    # - 监控报警规则
    rule_files:
    - "mysql-alter.rules"
    - "./rules/*-alter.rules"

    # - 报警管理服务设置
    alerting:
    alertmanagers:
    - scheme: http
    static_configs:
    - targets:
    - ["1.2.3.4:9093","1.2.3.5:9093","1.2.3.6:9093"]

    # - 在使用 pushgateway 组件时使用
    remote_write:
    - url: http://remote1/push
    name: drop_expensive
    write_relabel_configs:
    - source_labels: [__name__]
    regex: expensive.*
    action: drop
    - url: https://remote2/push
    name: rw_tls
    headers:
    name: value
    tls_config:
    cert_file: valid_cert_file
    key_file: valid_key_file

    remote_read:
    - url: http://remote1/read
    read_recent: true
    name: default
    - url: https://remote3/read
    read_recent: false
    name: read_special
    required_matchers:
    job: special
    tls_config:
    cert_file: valid_cert_file
    key_file: valid_key_file

    # - scrape 配置 (重点)
    scrape_configs:
    # - 工作任务1
    - job_name: prometheus
    # scrape_interval is defined by the configured global (60s).
    # scrape_timeout is defined by the global default (10s).
    honor_labels: true
    metrics_path: '/metrics'
    scheme: 'http'
    file_sd_configs:
    - files:
    - foo/*.slow.json
    - foo/*.slow.yml
    - single/file.yml
    refresh_interval: 10m
    - files:
    - bar/*.yaml

    static_configs:
    - targets: ['localhost:9090', 'localhost:9191']
    labels:
    key1: label
    your: label

    relabel_configs:
    - source_labels: [job, __meta_dns_name]
    regex: (.*)some-[regex]
    target_label: job
    replacement: foo-${1}
    action: 'replace'
    - source_labels: [abc]
    target_label: cde
    - replacement: static
    target_label: abc
    - regex:
    replacement: static
    target_label: abc

    authorization:
    credentials_file: valid_token_file

    # - 工作任务2
    - job_name: service-x
    scrape_interval: 50s
    scrape_timeout: 5s
    sample_limit: 1000
    metrics_path: /my_path
    scheme: https
    basic_auth:
    username: admin_name
    password: "multiline\nmysecret\ntest"
    dns_sd_configs:
    - refresh_interval: 15s
    names:
    - first.dns.address.domain.com
    - second.dns.address.domain.com
    - names:
    - first.dns.address.domain.com
    # refresh_interval defaults to 30s.

    relabel_configs:
    - source_labels: [job]
    regex: (.*)some-[regex]
    action: drop
    - source_labels: [__address__]
    modulus: 8
    target_label: __tmp_hash
    action: hashmod
    - source_labels: [__tmp_hash]
    regex: 1
    action: keep
    - action: labelmap
    regex: 1
    - action: labeldrop
    regex: d
    - action: labelkeep
    regex: k

    metric_relabel_configs:
    - source_labels: [__name__]
    regex: expensive_metric.*
    action: drop
    - source_labels: [pod_name]
    separator: ;
    regex: (.+)
    target_label: pod
    replacement: $1
    action: replace
    # - 工作任务2 - consul 服务发现
    - job_name: service-y
    consul_sd_configs:
    - server: 'localhost:1234'
    token: mysecret
    services: ['nginx', 'cache', 'mysql']
    tags: ["canary", "v1"]
    node_meta:
    rack: "123"
    allow_stale: true
    scheme: https
    tls_config:
    ca_file: valid_ca_file
    cert_file: valid_cert_file
    key_file: valid_key_file
    insecure_skip_verify: false

    relabel_configs:
    - source_labels: [__meta_sd_consul_tags]
    separator: ','
    regex: label:([^=]+)=([^,]+)
    target_label: ${1}
    replacement: ${2}

    # - 工作任务3
    - job_name: service-z
    tls_config:
    cert_file: valid_cert_file
    key_file: valid_key_file
    authorization:
    credentials: mysecret

    # - 工作任务4 - kubernetes 相关服务发现(重点)
    - job_name: service-kubernetes
    kubernetes_sd_configs:
    - role: endpoints
    api_server: 'https://localhost:1234'
    tls_config:
    cert_file: valid_cert_file
    key_file: valid_key_file
    basic_auth:
    username: 'myusername'
    password: 'mysecret'
    - job_name: service-kubernetes-namespaces
    kubernetes_sd_configs:
    - role: endpoints
    api_server: 'https://localhost:1234'
    namespaces:
    names:
    - default
    basic_auth:
    username: 'myusername'
    password_file: valid_password_file

    # - 工作任务5
    - job_name: service-marathon
    marathon_sd_configs:
    - servers:
    - 'https://marathon.example.com:443'
    auth_token: "mysecret"
    tls_config:
    cert_file: valid_cert_file
    key_file: valid_key_file

    # - 工作任务6
    - job_name: service-ec2
    ec2_sd_configs:
    - region: us-east-1
    access_key: access
    secret_key: mysecret
    profile: profile
    filters:
    - name: tag:environment
    values:
    - prod
    - name: tag:service
    values:
    - web
    - db

    # - 工作任务7
    - job_name: service-azure
    azure_sd_configs:
    - environment: AzurePublicCloud
    authentication_method: OAuth
    subscription_id: 11AAAA11-A11A-111A-A111-1111A1111A11
    tenant_id: BBBB222B-B2B2-2B22-B222-2BB2222BB2B2
    client_id: 333333CC-3C33-3333-CCC3-33C3CCCCC33C
    client_secret: mysecret
    port: 9100

    # - 工作任务8
    - job_name: service-nerve
    nerve_sd_configs:
    - servers:
    - localhost
    paths:
    - /monitoring
    # - 工作任务9
    - job_name: 0123service-xxx
    metrics_path: /metrics
    static_configs:
    - targets:
    - localhost:9090
    # - 工作任务10
    - job_name: badfederation
    honor_timestamps: false
    metrics_path: /federate
    static_configs:
    - targets:
    - localhost:9090
    # - 工作任务11(支持中文和繁文)
    - job_name: 测试
    metrics_path: /metrics
    static_configs:
    - targets:
    - localhost:9090
    # - 工作任务12
    - job_name: service-triton
    triton_sd_configs:
    - account: 'testAccount'
    dns_suffix: 'triton.example.com'
    endpoint: 'triton.example.com'
    port: 9163
    refresh_interval: 1m
    version: 1
    tls_config:
    cert_file: valid_cert_file
    key_file: valid_key_file
    # - 工作任务13
    - job_name: digitalocean-droplets
    digitalocean_sd_configs:
    - authorization:
    credentials: abcdef
    # - 工作任务14
    - job_name: dockerswarm
    dockerswarm_sd_configs:
    - host: http://127.0.0.1:2375
    role: nodes
    # - 工作任务15 - (openstack)
    - job_name: service-openstack
    openstack_sd_configs:
    - role: instance
    region: RegionOne
    port: 80
    refresh_interval: 1m
    tls_config:
    ca_file: valid_ca_file
    cert_file: valid_cert_file
    key_file: valid_key_file
    # - 工作任务16
    - job_name: hetzner
    hetzner_sd_configs:
    - role: hcloud
    authorization:
    credentials: abcdef
    - role: robot
    basic_auth:
    username: abcdef
    password: abcdef
    # - 工作任务17
    - job_name: service-eureka
    eureka_sd_configs:
    - server: 'http://eureka.example.com:8761/eureka'
    # - 工作任务18
    - job_name: scaleway
    scaleway_sd_configs:
    - role: instance
    project_id: 11111111-1111-1111-1111-111111111112
    access_key: SCWXXXXXXXXXXXXXXXXX
    secret_key: 11111111-1111-1111-1111-111111111111
    - role: baremetal
    project_id: 11111111-1111-1111-1111-111111111112
    access_key: SCWXXXXXXXXXXXXXXXXX
    secret_key: 11111111-1111-1111-1111-111111111111
  • 2.2) kubernetes 集群监控服务发现配置: https://github.com/prometheus/prometheus/blob/release-2.26/documentation/examples/prometheus-kubernetes.yml

  • 2.3) # - 补充: 实际工作任务示例19

    1
    2
    3
    4
    5
    6
    7
    8
    9
    10
    11
    12
    13
    14
    15
    16
    17
    18
    19
    20
    21
    22
    23
    24
    25
    26
    27
    28
    29
    30
    31
    32
    33
    34
    35
    36
    37
    38
    - job_name: 'prometheus'  ###这个必须配置,这个地址抓取的所有数据会自动加上`job=prometheus`的标签   
    # metrics_path defaults to '/metrics' #抓取监控目标的路径,默认是/metrics 可以根据自己业务的需要进行修 
    # scheme defaults to 'http'.   
    static_configs:   #这是通过静态文件的配置方法:这种方法直接指定要抓去目标的ip和端口   
    - targets: ['localhost:9090'] 
    - job_name: gateway   
    static_configs:    
    - targets: ['127.0.0.1:9091']     
    labels:   # 打上标签 instance会被指定为'gataway'
    instance: gataway 
    - job_name: node_export   
    file_sd_configs:      
    refresh_interval: 1m # 刷新发现文件的时间间隔     
    - files:
    - /data/prometheus-2.12.0.linux-amd64/node_discovery.json 
    - job_name: mysql_discovery
    file_sd_configs:
    refresh_interval: 1m # 刷新发现文件的时间间隔     
    - files:       
    - /data/prometheus-2.12.0.linux-amd64/mysql_discovery.json 
    - job_name: redis_discovery   
    file_sd_configs:      
    refresh_interval: 1m # 刷新发现文件的时间间隔     
    - files:  # 备注:尽量使用动态发现的配置以免配置文件过长
    - /data/prometheus-2.12.0.linux-amd64/redis_discovery.yaml

    ################# discovery files 模版示例 #################
    # 方式1./data/prometheus-2.12.0.linux-amd64/node_discovery.json 
    [
    {"targets": ["127.0.0.1:9100"],"labels": {"instance": "test","idc": "beijing"}},
    {"targets": ["127.0.0.1:9101"],"labels": {"instance": "test2","idc": "beijing"}}
    ]

    # 方式2./data/prometheus-2.12.0.linux-amd64/redis_discovery.yaml
    - targets: [ '127.0.0.1:9199','192.168.1.1:9199' ]
    labels: { "env": "production","instance": "node-1" }
    - targets: [ '192.168.1.3:9199','192.168.1.3:9199' ]
    labels: { "env": "production","instance": "node-2" }


(3) API Rsetful

描述: Prometheus 在 2.0 版本以后已经提供了一个简单的管理接口,可以方便我们进行对Prometheus数据库的增删改查,注意如果要使用API就必须添加启动参数--web.enable-admin-api默认是关闭的。

下述是Prometheus常用的API RESTful接口示例,如果想要使用:

1
2
3
4
5
6
7
8
9
10
11
12
13
14
15
16
17
# (1) 查询指定参数返回的指标名称和值
http://192.168.12.107:30090/api/v1/series?match[]=up
http://192.168.12.107:30090/api/v1/series?match[]={service_name=%22kube-state-metrics%22}


# (2) 查询指定标签的Values值
http://192.168.12.107:30090/api/v1/label/instance/values
# status "success"
# data […]


# (3) 删除tsdb中指定Job Name的metric
http://localhost:30090/api/v1/admin/tsdb/delete_series?match[]=up&match[]={job=~'kubernetes-kube-state'}"


# (4) 通过API接口进行重载Prometheus配置
http://localhost:30090/-/reload


Alert.rules

描述: 该文件主要是记录(Recording)规则和警报(Alert)规则文件,将Prometheus服务端pull下来的监控指标参数进行匹配对比,如匹配上则报警或者例利用Alertmanager发送报警信息。

Prometheus 支持两种类型的规则可以配置然后定期评估:记录规则和警报规则, 要在Prometheus中包含规则请创建一个包含必要规则语句的文件, 并让Prometheus通过Prometheus配置中的rule_files字段加载该文件(YAML格式)。

(1) 语法格式

  • 1.录制规则(Defining recording rules): 录制规则允许您预计算经常需要或计算代价高昂的表达式,并将其结果保存为一组新的时间序列。
    • 查询预计算结果通常比每次需要时执行原始表达式快得多, 这对于仪表板尤其有用,由于仪表板每次刷新时都需要重复查询相同的表达式。
      1
      2
      3
      4
      5
      6
      7
      8
      9
      10
      11
      12
      13
      14
      15
      16
      17
      18
      19
      20
      21
      22
      23
      # Syntax-checking rules 
      promtool check rules /path/to/example.rules.yml

      # Syntax
      groups:
      # The name of the group. Must be unique within a file.
      name: <string>
      # How often rules in the group are evaluated.
      [ interval: <duration> | default = global.evaluation_interval ]

      rules:
      # ------- 录制规则的语法为:---------
      # The name of the time series to output to. Must be a valid metric name.
      record: <string>

      # The PromQL expression to evaluate. Every evaluation cycle this is
      # evaluated at the current time, and the result recorded as a new set of
      # time series with the metric name as given by 'record'.
      expr: <string>

      # Labels to add or overwrite before storing the result.
      labels:
      [ <labelname>: <labelvalue> ]


  • 2.警报规则(Alerting rules):允许您基于 Prometheus expression语言表达式定义警报条件,并向外部服务发送有关触发警报的通知。每当警报表达式在给定的时间点产生一个或多个向量元素时,警报将对这些元素的标签集计为活动。
    1
    2
    3
    4
    5
    6
    7
    8
    9
    10
    11
    12
    13
    14
    15
    16
    17
    18
    19
    20
    21
    22
    23
    24
    25
    26
    27
    28
    # Syntax
    groups:
    # The name of the group. Must be unique within a file.
    name: <string>
    # How often rules in the group are evaluated.
    [ interval: <duration> | default = global.evaluation_interval ]

    rules:
    # ------- 警报规则的语法是:---------
    # The name of the alert. Must be a valid label value.
    alert: <string>

    # The PromQL expression to evaluate. Every evaluation cycle this is
    # evaluated at the current time, and all resultant time series become
    # pending/firing alerts.
    expr: <string>

    # Alerts are considered firing once they have been returned for this long.
    # Alerts which have not yet fired for long enough are considered pending.
    [ for: <duration> | default = 0s ]

    # Labels to add or overwrite for each alert.
    labels:
    [ <labelname>: <tmpl_string> ]

    # Annotations to add to each alert.
    annotations:
    [ <labelname>: <tmpl_string> ]


(2) 基础示例

  • 1) Defining recording rules: A simple example rules file would be:

    1
    2
    3
    4
    5
    6
    7
    8
    9
    10
    11
    12
    13
    14
    15
    16
    17
    18
    19
    20
    21
    22
    23
    24
    25
    26
    27
    28
    29
    groups:
    - name: example
    rules:
    - record: job:http_inprogress_requests:sum
    expr: sum by (job) (http_inprogress_requests)

    # -- K8s Recording rule
    - name: k8s.rules
    rules:
    - expr: sum(rate(container_cpu_usage_seconds_total[5m])) by (namespace)
    record: namespace:container_memory_usage_bytes:sum
    - expr: sum(container_memory_usage_bytes) by (namespace)
    record: namespace:container_memory_usage_bytes:sum
    - expr: sum by (namespace,pod_name,container_name)(rate(container_cpu_usage_seconds_total[5m]))
    record: namespace_pod_name_container_name:container_cpu_usage_seconds_total:sum_rate
    ```

    - 2) Defining alerting rules: An example rules file with an alert would be:
    ```yaml
    groups:
    - name: example # 报警分组
    rules:
    - alert: HighRequestLatency # 报警名称
    expr: job:request_latency_seconds:mean5m{job="myjob"} > 0.5 # 规则表达式
    for: 10m # 持续时间如果在10m内多次收到报警则进行发送报警信息。
    labels: # 规则标签
    severity: critical # 报警级别
    annotations: # 注释 可以加入label值和value值
    summary: "Instance {{ $labels.instance }} High request latency"
  • 3) 实践环境中的报警规则

    1
    2
    3
    4
    5
    6
    7
    8
    9
    10
    11
    12
    13
    14
    15
    16
    17
    18
    19
    20
    21
    22
    23
    24
    25
    26
    27
    28
    29
    30
    31
    32
    33
    34
    35
    36
    37
    38
    39
    40
    41
    42
    43
    44
    45
    46
    47
    48
    49
    50
    51
    52
    53
    54
    55
    56
    57
    58
    59
    60
    61
    62
    63
    64
    65
    66
    67
    68
    69
    70
    71
    72
    73
    74
    75
    76
    77
    78
    79
    80
    81
    82
    83
    84
    85
    86
    87
    88
    89
    90
    91
    92
    93
    94
    95
    96
    97
    98
    99
    100
    101
    102
    103
    104
    105
    106
    107
    108
    109
    110
    111
    112
    groups:
    - name: 节点监控基础规则(Basic Rules)
    rules:
    - alert: 节点状态宕机
    expr: up == 0
    for: 2m
    labels:
    severity: critical
    status: down
    annotations:
    summary: "来自 {{ $labels.job }} Job,节点 {{$labels.instance}} 状态宕机"
    description: "节点 {{$labels.instance}} 宕机已超过2分钟请进行人工处理。"
    - alert: CPU 使用情况
    expr: 100-(avg(irate(node_cpu_seconds_total{mode="idle"}[5m])) by(instance)* 100) > 70
    ​ for: 5m
    ​ labels:
    severity: generality
    status: warning
    annotations:
    summary: "节点 {{$labels.mountpoint}} CPU 使用率过高!"
    description: "节点 {{$labels.mountpoint }} CPU已持续3分钟使用大于 70% (目前使用:{{$value}}%)"
    - alert: Memory 使用情况
    expr: 100 - (node_memory_MemTotal_bytes - node_memory_MemFree_bytes+node_memory_Buffers_bytes+node_memory_Cached_bytes ) / node_memory_MemTotal_bytes * 100 > 80
    ​ for: 1m
    ​ labels:
    severity: generality
    status: warning
    annotations:
    summary: "{{$labels.mountpoint}} 内存使用率过高!"
    description: "{{$labels.mountpoint }} 内存使用大于80%(目前使用:{{$value}}%)"
    - alert: IO 性能情况
    expr: 100 - (avg(irate(node_disk_io_time_seconds_total[5m])) by(instance)* 100) < 30
    for: 2m
    labels:
    severity: generality
    status: warning
    annotations:
    summary: "{{$labels.mountpoint}} 流入磁盘IO使用率过高!"
    description: "{{$labels.mountpoint }} 流入磁盘IO大于70%(目前使用:{{$value}})"
    - alert: Network 接收(receive)情况
    expr: ((sum(rate (node_network_receive_bytes_total{device!~'tap.*|veth.*|br.*|docker.*|virbr*|lo*'}[5m])) by (instance)) / 100) > 102400
    ​ for: 5m
    ​ labels:
    severity: generality
    status: warning
    annotations:
    summary: "{{$labels.mountpoint}} 流入网络带宽过高!"
    description: "{{$labels.mountpoint }} 流入网络带宽持续5分钟高于100M. RX带宽使用率{{$value}}"
    - alert: Network 传输(transmit)情况
    expr: ((sum(rate (node_network_transmit_bytes_total{device!~'tap.*|veth.*|br.*|docker.*|virbr*|lo*'}[5m])) by (instance)) / 100) > 102400
    ​ for: 1m
    ​ labels:
    severity: generality
    status: warning
    annotations:
    summary: "{{$labels.mountpoint}} 流出网络带宽过高!"
    description: "{{$labels.mountpoint }}流出网络带宽持续2分钟高于100M. RX带宽使用率{{$value}}"
    - alert: TCP会话
    expr: node_netstat_Tcp_CurrEstab > 1000
    ​ for: 1m
    ​ labels:
    severity: generality
    status: warning
    annotations:
    summary: "{{$labels.mountpoint}} TCP_ESTABLISHED过高!"
    description: "{{$labels.mountpoint }} TCP_ESTABLISHED大于1000%(目前使用:{{$value}}%)"
    - alert: 磁盘容量
    expr: 100-(node_filesystem_free_bytes{fstype=~"ext4|xfs"}/node_filesystem_size_bytes {fstype=~"ext4|xfs"}*100) > 80
    ​ for: 1m
    ​ labels:
    severity: generality
    status: warning
    annotations:
    summary: "{{$labels.mountpoint}} 磁盘分区使用率过高!"
    description: "{{$labels.mountpoint }} 磁盘分区使用大于80%(目前使用:{{$value}}%)"
    # -- 业务监控规则
    - name: 业务监控(Business monitoring)
    - alert: APIHighRequestLatency #对请求延迟中值大于1s的任何实例发出警报。
    expr: api_http_request_latencies_second{quantile="0.5"} > 1
    for: 10m
    labels:
    severity: generality
    status: warning
    annotations:
    summary: "High request latency on {{ $labels.instance }}"
    description: "{{ $labels.instance }} has a median request latency above 1s (current value: {{ $value }}s)"

    # -- 数据库监控规则
    - name: RedisAlert
    rules:
    - alert: Redis 内存情况
    expr: 100 * (redis_memory_used_bytes / redis_config_maxmemory) > 90
    for: 1m
    labels:
    severity: generality
    status: warning
    annotations:
    summary: "Redis {{ $labels.instance }} memory userd over 90"
    description: "Redis memory used over 90 duration above 1m"

    # -- 队列监控规则
    - name: KafkaAlert
    rules:
    - alert: kafka 消费者(Consumer)group_lag情况
    expr: sum(kafka_consumergroup_lag{instance != "kafka-dev" }) by (instance, consumergroup,topic) > 500
    for: 5m
    labels:
    severity: generality
    status: warning
    annotations:
    summary: "kafka {{ $labels.topic }} 消费延迟报警"
    description: "kafka 消费延迟有 {{ $value}} 队列数"

Tips : 规则检测频率时间是与全局变量中的evaluation_interval设置相关。
Tips : 标签和注释值可以使用控制台模板进行模板化。$labels变量保存警报实例的标签键/值对,可以通过$externalLabels变量访问配置的外部标签, $value变量保存警报实例的评估值。
Tips : 按照evaluation_interval配置该告警规则30s执行一次,如果持续for:2m即2分钟内收到数据则该警告会被触发,并且在达到设定得时间长度前该告警将处于pending状态。

Alertmanager.yml

描述: Alertmanager是通过命令行标志和配置文件配置的。当命令行标志配置不可变的系统参数时,配置文件定义禁止规则、通知路由和通知接收器(Prometheus的报警通知配置文件),要指定要加载的配置文件,请使用–config.file标志./alertmanager --config.file=alertmanager.yml

Alertmanager.yml Configuration file 主要配置对象:

1
2
3
4
5
6
7
8
9
10
11
12
13
14
15
16
17
18
19
20
21
22
23
24
# - 全局配置: 包括报警解决后的超时时间、SMTP 相关配置、各种渠道通知的 API 地址等等。
* <global>
* <http_config>
* <tls_config>
# - 用来设置报警的分发策略,它是一个树状结构,按照深度优先从左向右的顺序进行匹配。
* <route>
# - 抑制规则配置,当存在与另一组匹配的警报(源)时,抑制规则将禁用与一组匹配的警报(目标)。
* <inhibit_rule>
* <templates>
# - 配置告警消息接受者信息,例如常用的 email、wechat、slack、webhook 等消息通知方式。
* <receiver>
* <email_config>
* <pagerduty_config>
* <image_config>
* <link_config>
* <pushover_config>
* <slack_config>
* <action_config>
* <field_config>
* <opsgenie_config>
* <responder>
* <victorops_config>
* <webhook_config>
* <wechat_config>

Tips: 通用占位符定义如下:

  • <duration>:与正则表达式匹配的持续时间 [0-9]+(ms|[smhdwy])
  • <labelname>:与正则表达式匹配的字符串[a-zA-Z_][a-zA-Z0-9_]*
  • <labelvalue>:一串unicode字符
  • <filepath>:当前工作目录中的有效路径
  • <boolean>:可以接受值的布尔值true或false
  • <string>:常规字符串
  • <secret>:是秘密的常规字符串,例如密码
  • <tmpl_string>:使用前已模板扩展的字符串
  • <tmpl_secret>:一个字符串,在使用前会进行模板扩展,这是一个秘密
  • <int>:一个整数值


(1) 语法格式

1
2
3
4
5
6
7
8
9
10
11
12
13
14
15
16
17
18
19
20
21
22
23
24
25
26
27
28
29
30
31
32
33
34
35
36
37
38
39
40
41
42
43
44
45
46
47
48
49
50
51
52
53
54
55
56
57
58
59
60
61
62
63
64
65
66
67
68
69
70
71
72
73
74
75
76
77
78
79
80
81
82
83
84
85
86
87
88
89
90
91
92
93
94
95
96
97
98
99
100
101
102
103
104
105
106
107
108
109
110
111
112
113
114
115
116
117
118
119
120
121
122
123
124
125
126
127
128
129
130
131
132
133
134
135
136
137
138
139
140
141
142
143
144
145
146
147
148
149
150
151
152
153
154
155
156
157
158
159
160
161
162
163
164
165
166
167
168
169
# - 全局配置指定在所有其他配置上下文中有效的参数,它们也可以作为其他配置部分的默认值。
global:
# The default SMTP From header field.
[ smtp_from: <tmpl_string> ]
# The default SMTP smarthost used for sending emails, including port number.
# Port number usually is 25, or 587 for SMTP over TLS (sometimes referred to as STARTTLS).
[ smtp_smarthost: <string> ] # Example: smtp.example.org:587
# The default hostname to identify to the SMTP server.
[ smtp_hello: <string> | default = "localhost" ]
# SMTP Auth using CRAM-MD5, LOGIN and PLAIN. If empty, Alertmanager doesn't authenticate to the SMTP server.
[ smtp_auth_username: <string> ]
# SMTP Auth using LOGIN and PLAIN.
[ smtp_auth_password: <secret> ]
# SMTP Auth using PLAIN.
[ smtp_auth_identity: <string> ]
# SMTP Auth using CRAM-MD5.
[ smtp_auth_secret: <secret> ]
# The default SMTP TLS requirement.
# Note that Go does not support unencrypted connections to remote SMTP endpoints.
[ smtp_require_tls: <bool> | default = true ]

# 用于延迟通知的API URL
[ slack_api_url: <secret> ]
[ victorops_api_key: <secret> ]
[ victorops_api_url: <string> | default = "https://alert.victorops.com/integrations/generic/20131114/alert/" ]
[ pagerduty_url: <string> | default = "https://events.pagerduty.com/v2/enqueue" ]
[ opsgenie_api_key: <secret> ]
[ opsgenie_api_url: <string> | default = "https://api.opsgenie.com/" ]
[ wechat_api_url: <string> | default = "https://qyapi.weixin.qq.com/cgi-bin/" ]
[ wechat_api_secret: <secret> ]
[ wechat_api_corp_id: <string> ]

# - 默认的HTTP客户端配置
# Note that `basic_auth`, `bearer_token` and `bearer_token_file` options are mutually exclusive(相互排斥).
[ http_config: <http_config> ]
# Sets the `Authorization` header with the configured username and password.
# password and password_file are mutually exclusive.
basic_auth:
[ username: <string> ]
[ password: <secret> ]
[ password_file: <string> ]

# Sets the `Authorization` header with the configured bearer token.
[ bearer_token: <secret> ]

# Sets the `Authorization` header with the bearer token read from the configured file.
[ bearer_token_file: <filepath> ]

# Configures the TLS settings.
tls_config:
# CA certificate to validate the server certificate with.
[ ca_file: <filepath> ]

# Certificate and key files for client cert authentication to the server.
[ cert_file: <filepath> ]
[ key_file: <filepath> ]

# ServerName extension to indicate the name of the server.
# http://tools.ietf.org/html/rfc4366#section-3.1
[ server_name: <string> ]

# Disable validation of the server certificate.
[ insecure_skip_verify: <boolean> | default = false]

# Optional proxy URL.
[ proxy_url: <string> ]

[ resolve_timeout: <duration> | default = 5m ] # 默认的HTTP客户端配置


# - 从中读取自定义通知模板定义的文件,最后一个组件可以使用通配符匹配器,例如“templates/*.tmpl”。
templates:
[ - <filepath> ... ]

# - 路由块定义路由树中的节点及其子节点。如果未设置则从其父节点继承其可选配置参数。
route: <route>
[ receiver: <string> ]
# 用于将传入警报分组在一起的标签。例如,cluster=A和alertname=LatencyHigh的多个警报将被批处理到单个组中。
# To aggregate by all possible labels use the special value '...' as the sole label name, for example:
# group_by: ['...']
# 这将有效地完全禁用聚合,按原样传递所有警报。这不太可能是您想要的,除非您的警报量非常低,或者您的上游通知系统执行自己的分组。
[ group_by: [ <labelname>, ... ] ]

# 警报是否应继续匹配后续同级节点。
[ continue: <boolean> | default = false ]

# 警报必须满足的一组相等匹配器才能匹配节点。
match:
[ <labelname>: <labelvalue>, ... ]

# 警报必须满足的一组正则表达式匹配器才能匹配节点。
match_re:
[ <labelname>: <regex>, ... ]

# 为一组警报发送通知的初始等待时间。允许等待禁止警报到达或为同一组收集更多初始警报(通常是0到几分钟。)
[ group_wait: <duration> | default = 30s ]

# 在发送有关添加到已发送初始通知的警报组中的新警报的通知之前要等待多长时间(通常约5分钟或以上。)
[ group_interval: <duration> | default = 5m ]

# 如果警报已成功发送,则在再次发送通知之前要等待多长时间(通常约3小时或以上)。
[ repeat_interval: <duration> | default = 4h ]

# 零个或多个子路由。
routes:
[ - <route> ... ]


# 通知接收者列表:Receiver是一个或多个通知集成的命名配置(此处正对于webhook与wechat详细讲解)。
receivers:
- name: <string> # 接收方的唯一名称。
# 多个通知集成的配置。
webhook_configs: # - webhook接收器允许配置通用接收器。
[ send_resolved: <boolean> | default = true ] # 是否通知已解决的警报。
url: <string> # POST 请求地址
[ http_config: <http_config> | default = global.http_config ] # HTTP客户端的配置。
[ max_alerts: <int> | default = 0 ] # 单个webhook消息中包含的最大警报数, 将其保留为默认值 0 包括所有警报。

wechat_configs: # - 微信通知通过微信API发送。
[ send_resolved: <boolean> | default = false ]

# The API key to use when talking to the WeChat API.
[ api_secret: <secret> | default = global.wechat_api_secret ]

# The WeChat API URL.
[ api_url: <string> | default = global.wechat_api_url ]

# The corp id for authentication.
[ corp_id: <string> | default = global.wechat_api_corp_id ]

# API request data as defined by the WeChat API.
# [ message: <tmpl_string> | default = '{{ template "wechat.default.message" . }}' ]
# [ agent_id: <string> | default = '{{ template "wechat.default.agent_id" . }}' ]
# [ to_user: <string> | default = '{{ template "wechat.default.to_user" . }}' ]
# [ to_party: <string> | default = '{{ template "wechat.default.to_party" . }}' ]
# [ to_tag: <string> | default = '{{ template "wechat.default.to_tag" . }}' ]

email_configs:
[ - <email_config>, ... ]
victorops_configs:
[ - <victorops_config>, ... ]
pagerduty_configs: # PagerDuty通知通过PagerDuty API发送
[ - <pagerduty_config>, ... ]
pushover_configs:
[ - <pushover_config>, ... ]
slack_configs:
[ - <slack_config>, ... ]
opsgenie_configs:
[ - <opsgenie_config>, ... ]


# - 抑制规则列表: 当存在与另一组匹配器匹配的警报(源)时,禁止规则会使与一组匹配器匹配的警报(目标)静音。对于相等列表中的标签名称,目标警报和源警报必须具有相同的标签值。
inhibit_rules:
# Matchers that have to be fulfilled in the alerts to be muted.
target_match:
[ <labelname>: <labelvalue>, ... ]
target_match_re:
[ <labelname>: <regex>, ... ]

# Matchers for which one or more alerts have to exist for the
# inhibition to take effect.
source_match:
[ <labelname>: <labelvalue>, ... ]
source_match_re:
[ <labelname>: <regex>, ... ]

# Labels that must have an equal value in the source and target
# alert for the inhibition to take effect.
[ equal: '[' <labelname>, ... ']' ]


(2) 基础示例

  • 1.官方示例: https://github.com/prometheus/alertmanager/blob/master/doc/examples/simple.yml

    1
    2
    3
    4
    5
    6
    7
    8
    9
    10
    11
    12
    13
    14
    15
    16
    17
    18
    19
    20
    21
    22
    23
    24
    25
    26
    27
    28
    29
    30
    31
    32
    33
    34
    35
    36
    37
    38
    39
    40
    41
    42
    43
    44
    45
    46
    47
    48
    49
    50
    51
    52
    53
    54
    55
    56
    57
    58
    59
    60
    61
    62
    63
    64
    65
    66
    67
    68
    69
    70
    71
    72
    73
    74
    75
    76
    77
    78
    79
    80
    81
    82
    83
    84
    85
    86
    87
    88
    89
    90
    91
    global:
    # The smarthost and SMTP sender used for mail notifications.
    smtp_smarthost: 'localhost:25'
    smtp_from: 'alertmanager@example.org'
    smtp_auth_username: 'alertmanager'
    smtp_auth_password: 'password'

    # The directory from which notification templates are read.
    templates:
    - '/etc/alertmanager/template/*.tmpl'

    # The root route on which each incoming alert enters.
    route:
    receiver: 'default-receiver' # 默认接收器
    group_by: ['alertname', 'cluster', 'service'] # 用于将传入警报分组在一起的标签。
    group_wait: 30s # 当传入警报创建新的警报组时,请至少等待“group_wait”以发送初始通知。\
    group_interval: 5m # 发送第一个通知时,请等待“group_interval”以发送一批新警报,这些警报已开始为该组触发。
    repeat_interval: 3h # 如果警报已成功发送,请等待“重复间隔”发送警报。
    # - 所有上述属性都由所有子路由继承,并且可以在每个子路由上覆盖。


    # 子路由设置
    routes:
    # 此路由对警报标签执行正则表达式匹配,以捕获与服务列表相关的警报。
    - match_re: # 该服务有一个子路由用于关键警报,即任何不匹配的警报,即 severity != critical,退回到父节点并发送到“team-X-Mail”
    service: ^(foo1|foo2|baz)$
    receiver: team-X-mails
    routes:
    - match:
    severity: critical
    receiver: team-X-pager
    - match: # 匹配到 service == files 并且 severity == critical 采用 team-Y-pager 接收器发送信息
    service: files
    receiver: team-Y-mails
    routes:
    - match:
    severity: critical
    receiver: team-Y-pager

    - match: # 此路由处理来自数据库服务的所有警报。如果没有团队来处理则默认为DB团队。
    service: database
    receiver: team-DB-pager
    group_by: [alertname, cluster, database] # 还按受影响的数据库对警报进行分组。
    routes:
    - match:
    owner: team-X
    receiver: team-X-pager
    continue: true
    - match:
    owner: team-Y
    receiver: team-Y-pager

    # 所有service=mysql或service=cassandra的警报都会被发送到数据库寻呼机。
    - receiver: 'database-pager'
    group_wait: 10s
    match_re:
    service: mysql|cassandra
    # 所有带有team=frontend标签的警报都与此子路由匹配。它们按产品和环境分组,而不是按集群和警报名称分组。
    - receiver: 'frontend-pager'
    group_by: [product, environment]
    match:
    team: frontend

    # 如果另一个警报正在触发,抑制规则允许将一组警报静音。如果同一个警报已经很严重,我们可以使用它来禁用任何警告级别的通知。
    inhibit_rules:
    - source_match:
    severity: 'critical'
    target_match:
    severity: 'warning'
    # 如果alertname相同,则应用抑制。
    # 注意:如果源警报和目标警报中都缺少“equal”中列出的所有标签名称,则将应用禁止规则!
    equal: ['alertname', 'cluster', 'service']

    receivers:
    - name: 'team-X-mails' # team-X-mails 接收器
    email_configs:
    - to: 'team-X+alerts@example.org'
    - name: 'team-X-pager' # team-X-pager 接收器
    email_configs:
    - to: 'team-X+alerts-critical@example.org'
    pagerduty_configs:
    - service_key: <team-X-key>
    - name: 'team-Y-mails'
    email_configs:
    - to: 'team-Y+alerts@example.org'
    - name: 'team-Y-pager'
    pagerduty_configs:
    - service_key: <team-Y-key>
    - name: 'team-DB-pager'
    pagerduty_configs:
    - service_key: <team-DB-key>
  • 2.自定义常用示例:

    1
    2
    3
    4
    5
    6
    7
    8
    9
    10
    11
    12
    13
    14
    15
    16
    17
    18
    19
    20
    21
    22
    23
    24
    25
    26
    27
    28
    29
    30
    31
    32
    33
    34
    35
    36
    37
    38
    39
    40
    41
    42
    global:
    group_wait: 30s 
    group_interval: 10m 
    repeat_interval: 10m 
    resolve_timeout: 5m
    group_by: ['alertname','cluster']
    templates:
      - 'demo.tmpl'
    route: 
    receiver: webhook 
    group_wait: 30s 
    group_interval: 10m 
    repeat_interval: 10m 
    group_by: ['alertname'] 
    routes: 
    - receiver: webhook   
    group_wait: 10s   
    match:     
    job_name: mysql|kubernetes 
    - receiver: 'webhook-kafka'   
    group_by: [instance, alertname]   
    match_re:     
    instance: ^kafka-(.*)

    # alertmanager抑制
    inhibit_rules:
    - source_match:
    altername: 'Dingtaik api 调用过多'
    severity: 'critical'
    target_macth:
    severity: 'warning'
    equal: ['alertname','instance']

    receivers:
    - name: webhook 
    webhook_configs: 
    - url: http://localhost:8060/dingtalk/ops_dingding/send    
    send_resolved: true
    - name: webhook-kafka 
    webhook_configs: 
    - url: http://localhost:8062/dingtalk/ops_59/send   
    send_resolved: true

Tips : 我们没有主动添加新的接收器,建议通过webhook接收器实现自定义通知集成。