[TOC]
0x00 Alertmanager 快速入门
1.基础介绍
描述: Alertmanager 负责接收来自所有Prometheus服务器的告警,并根据其规则将告警以邮件、聊天信息和呼叫等方式进行通知。
Tips : 注意在使用告警规则文件前必须在prometheus.yaml中设置抓取目标以及加载规则文件,使用记录告警规则可以让Prometheus定期执行PromQL表达式并记录其结果。

[TOC]
描述: Alertmanager 负责接收来自所有Prometheus服务器的告警,并根据其规则将告警以邮件、聊天信息和呼叫等方式进行通知。
Tips : 注意在使用告警规则文件前必须在prometheus.yaml中设置抓取目标以及加载规则文件,使用记录告警规则可以让Prometheus定期执行PromQL表达式并记录其结果。
[TOC]
描述: Alertmanager 负责接收来自所有Prometheus服务器的告警,并根据其规则将告警以邮件、聊天信息和呼叫等方式进行通知。
Tips : 注意在使用告警规则文件前必须在prometheus.yaml中设置抓取目标以及加载规则文件,使用记录告警规则可以让Prometheus定期执行PromQL表达式并记录其结果。1
2
3
4
5
6
7
8
9alerting:
alertmanagers:
- follow_redirects: true
scheme: http
timeout: 10s
api_version: v2
static_configs:
- targets:
- localhost:9093
Prometheus 告警分为两个部分进行实现监控规则匹配以及告警信息的通知。
Prometheus中添加告警规则,定义告警产生的逻辑。Alertmanager系统将触发的警报转化为通知,例如邮件、呼叫和聊天消息。通知管道流程
repeat_interval。告警状态
Prometheus Alert 告警状态有三种状态:Inactive、Pending、Firing。
参考来源
描述: 下面主要讲解接收者(receiver)、路由树(route)、分组(Groupby)、抑制重复、已处理通知、抑制警告。
接收者
描述: receiver 字段指定了告警通知哪种方式进行发送,国内常用email、webhook、钉钉或者企业微信等方式进行告警,它也支持HipChat、PagerDuty(可以进行确认警告)、Pushover、Slack、OpsGenie、VictorOps等。
路由树
描述: route 字段指定顶级它是默认路由,根路由下可以设置许多字路由(你可将其比喻作根域名),路由的匹配是当告警规则到来后根据其携带的标签进行判断,如果匹配子路由1的规则就会匹配次路由并且停止继续匹配,如果不匹配将会对子路由2的规则进行匹配,如都没匹配到则采用根路由的设置。
Tips : Prometheus 官方有提供一个可视化路由编辑器,可以显示该树以及告警遵循的路由。
分组
描述: group_by 字段允许你指定标签列表对告警进行分组,在未设置分组时该路由默认将所有路由都放入一个组中,意味着你将得到一个内容很大的通知。当在设置分组后可以按照报警等级、环境、以及location来进行拆分警告。
注意: 通常按照instance标签进行分组并不是一个好主意,因为当存在影响整个应用程序的问题时,它可能会导致大量信息。
1 | # 个人理解(伪配置) |
抑制重复
描述: 如果你不希望每次触发告警后当告警集发生改变时都将收到新的通知,这会导致大量的垃圾邮件。
此时我们可以使用 group_wait(每个来的警告组【Firing】发送等待) 与 group_interval(发送一个警告组后,下一组警告组的等待时间) 、repeat_interval(发送警告成功后,如果在上面两个参数指定的时间内没有完成时,将等待该参数时间到了,便继续发送-推荐设置4H)来设置Altermanager通知分组限制。
Tips : repeat_interval 必须要比 group_interval 大否则将无任何意义。
已处理通知
描述: send_resolved 字段,当告警问题解决后是否发送通知,启用后将在下一个通知包含此告警,如果列表中没有其它告警触发,它甚至只会发送已经解决通知的警告。
抑制警告
描述: inhibit_rules 字段 ,允许你在其它告警被触发时将某些警告视为不触发。例如数据迁移后旧的机器出现问题但由于用户数据已经转移到其它地方,那么发送此种警告便没有多大意义。
1 | # (1) 全局设置 |
描述: 我们知道 Alertmanager 要进行警告必须需要编写对应的告警规则,然后以告警自定义模板文件进行通知接收者。
prometheus.yml和rule.yml文件后分别使用promtool check (config|rules) 进行检测。level:metric:operations如是job_name:up:rate5mTips : 对于告警规则过滤是必不可少的,评估告警表达式返回空的瞬时向量不会触发任何告警规则,但如果任何样本返回每个都将成为告警。
基础告警规则配置:1
2
3
4
5
6
7
8
9
10
11
12
13
14
15
16
17
18
19
20
21
22
23
24
25
26
27
28
29
30
31
32
33
34
35
36
37
38
39
40
41
42
43
44
45
46
47
48
49
50
51
52
53
54
55
56
57
58
59
60
61
62
63
64
65
66
67
68
69
70
71
72
73groups:
- name: node-alert
rules:
- alert: "监控节点丢失或宕机"
expr: avg without()(up) < 1
for: 2m
labels:
severity: 'critical'
annotations:
message: "服务器实例 [{{ $labels.instance }}]节点丢失或宕机,"
description: "请系统管理员尽快进行人工干预处理!"
- alert: "L-五分钟内CPU使用率大于90%"
expr: (node_load5 /ignoring(mode) count without(cpu)(node_cpu_seconds_total{mode="idle"}) * 100) > 90
for: 3m
labels:
severity: warning
annotations:
message: "服务器实例 {{ $labels.instance }} CPU 使用率 告警通知"
description: "{{ $labels.instance }}CPU使用率已超过90%, 当前值: {{ $value }}%"
- alert: "L-内存可用容量小于 10%"
expr: ((node_memory_MemTotal_bytes - node_memory_MemFree_bytes - node_memory_Buffers_bytes - node_memory_Cached_bytes) / (node_memory_MemTotal_bytes )) * 100 > 80
for: 2m
labels:
severity: warning
annotations:
message: "服务器实例 {{ $labels.instance }} 内存不足 告警通知"
description: "{{ $labels.instance }} 内存可用资源已不足 10%,当前值: {{ $value }} %"
- alert: "L-磁盘可用容量小于 10%"
expr: round(100 - ((node_filesystem_avail_bytes{mountpoint=~".*",fstype=~"nfs|ext4|xfs|ext2|ext3"} * 100) / node_filesystem_size_bytes {mountpoint=~".*",fstype=~"nfs|ext4|xfs|ext2|ext3"}) > 90)
for: 3m
labels:
severity: warning
annotations:
message: "服务器实例 {{ $labels.instance }} 磁盘不足 告警通知"
description: "{{ $labels.instance }} 磁盘 {{ $labels.device }} 资源 已不足 10%, 当前值: {{ $value }}%"
- alert: "W-内存可用容量小于 10%"
expr: round((1 - (windows_os_physical_memory_free_bytes / windows_cs_physical_memory_bytes)) * 100) > 90
for: 2m
labels:
severity: warning
annotations:
message: "服务器实例 {{ $labels.instance }} 内存不足 告警通知"
description: "{{ $labels.instance }} 内存可用资源已不足 10%,当前值: {{ $value }}"
- alert: "W-磁盘可用容量小于 10%"
expr: round((1 - windows_logical_disk_free_bytes{volume=~"C:|D:|E:|F:"} / windows_logical_disk_size_bytes{volume=~"C:|D:|E:|F:"} ) * 100 > 90)
for: 3m
labels:
severity: warning
annotations:
message: "服务器实例 {{ $labels.instance }} 磁盘不足 告警通知"
description: "{{ $labels.instance }} 磁盘 {{ $labels.volume }} 资源 已不足 10%, 当前值: {{ $value }}%"
- alert: "W-五分钟内CPU使用率大于 90%"
expr: round(100 - ((avg without(core,mode)(irate(windows_cpu_time_total{mode="idle"}[5m]))) * 100) > 90)
for: 3m
labels:
severity: warning
annotations:
message: "服务器实例 {{ $labels.instance }} CPU 使用率 告警通知"
description: "{{ $labels.instance }}CPU使用率已超过90%, 当前值: {{ $value }}%"
- alert: "Website-网站服务访问状态异常"
expr: probe_success{job="HTTP-Check"} < 1
for: 5m
labels:
severity: warning
annotations:
message: "网站地址 {{ $labels.http }} ,无法正常提供服务"
description: "请检查并恢复网站名称为 {{ $labels.site }} 应用服务,当前值: {{ $value }}%"
描述: alertmanager带有默认模板同时支持我们编写自定义报警通知模板,并且发送给接收者的通知是通过模板构建。除了文本字段可以模板化以外,还可模板化通知的目的地,通过传递在告警规则中添加指定接受用户标签,便可以在模板总引用并发生(非常Nice)。
Tips : 注意 Alertmanager 模板与 Prometheus 中的模板不同, Prometheus 模板还包括警报规则标签/注释中的模板。
参考地址: https://prometheus.io/docs/alerting/latest/notifications/
描述: 以下是警报和相应的 Alertmanager 配置文件设置 (alertmanager.yml) 的所有不同示例。
1 | # 模板代码块必须使用 {{ var }} 包含 |
Tips : 更多语法请参照使用 Go 模板系统(https://golang.org/pkg/text/template)。
描述: 数据是传递给通知模板和 webhook 推送的结构。
| Name | Type | Notes |
|---|---|---|
| Receiver | string | 定义通知将发送到的接收者名称(slack、电子邮件等)。 |
| Status | string | 如果至少有一个警报被触发,则定义为触发,否则已解决。 |
| Alerts | Alert | 该组中所有警报对象的列表: Alerts.Firing 返回该组中当前触发的警报对象的列表 Alerts.Resolved 返回此组中已解决警报对象的列表 |
| GroupLabels | KV | 这些警报分组所依据的标签。 |
| CommonLabels | KV | 所有警报通用的标签。 |
| CommonAnnotations | KV | 所有警报的通用注释集,用于有关警报的更长的附加信息字符串。 |
| ExternalURL | string | 反向链接到发送通知的 Alertmanager。 |
简单使用示例:
1 | # 实例instance标签 |
Alert 包含一个通知模板的警报。
| Name | Type | Notes |
|---|---|---|
| Status | string | 定义警报是否已解决或当前是否触发。 |
| Labels | KV | 要附加到警报的一组标签。 |
| Annotations | KV | 警报的一组注释。 |
| StartsAt | time.Time | 警报开始触发的时间。 如果省略当前时间由 Alertmanager 分配。 |
| EndsAt | time.Time | 仅在已知警报的结束时间时设置。 否则设置为自上次收到警报以来的可配置超时时间。 |
| GeneratorURL | string | 标识此警报的原因实体的反向链接。 |
| Fingerprint | string | 可用于识别警报的指纹。 |
1 | {{- range $index, $alert := .Alerts -}} |
描述: 请注意 Go 模板也提供的默认功能。
| Name | Arguments | Returns | Notes |
|---|---|---|---|
| title | string | strings.Title,将每个单词的第一个字符大写。 | |
| toUpper | string | strings.ToUpper,将所有字符转换为大写。 | |
| toLower | string | strings.ToLower,将所有字符转换为小写。 | |
| match | pattern, string | 正则表达式.MatchString。使用 Regexp 匹配字符串。 | |
| reReplaceAll | pattern, replacement, text | Regexp.ReplaceAllString 正则表达式替换,未锚定。 | |
| join | sep string, s []string | strings.Join,连接 s 的元素以创建单个字符串。 分隔符字符串 sep 放置在结果字符串中的元素之间。 (注意:参数顺序颠倒以便在模板中更容易流水线化。) | |
| safeHtml | text string | html/template.HTML,将字符串标记为不需要自动转义的 HTML。 | |
| stringSlice | …string | 将传递的字符串作为字符串切片返回。 |
描述: 在前面几章的学习中都没有讲解AlertManager报警管理系统的使用,博主专门把他放在本章进行讲解,因为其实现报警通知的方式有多种多样。
Email_config 配置参考: https://prometheus.io/docs/alerting/latest/configuration/#email_config1
2
3
4
5
6
7
8
9
10
11
12
13
14
15
16
17
18
19
20
21
22
23
24
25
26
27
28
29
30
31
32
33
34
35
36
37
38# - 注意此处非全局所以没有smtp前缀
# Whether or not to notify about resolved alerts.
[ send_resolved: <boolean> | default = false ]
# The email address to send notifications to.
to: <tmpl_string>
# The sender address.
[ from: <tmpl_string> | default = global.smtp_from ]
# The SMTP host through which emails are sent.
[ smarthost: <string> | default = global.smtp_smarthost ]
# The hostname to identify to the SMTP server.
[ hello: <string> | default = global.smtp_hello ]
# SMTP authentication information.
[ auth_username: <string> | default = global.smtp_auth_username ]
[ auth_password: <secret> | default = global.smtp_auth_password ]
[ auth_secret: <secret> | default = global.smtp_auth_secret ]
[ auth_identity: <string> | default = global.smtp_auth_identity ]
# The SMTP TLS requirement.
# Note that Go does not support unencrypted connections to remote SMTP endpoints.
[ require_tls: <bool> | default = global.smtp_require_tls ]
# TLS configuration.
tls_config:
[ <tls_config> ]
# The HTML body of the email notification.
[ html: <tmpl_string> | default = '{{ template "email.default.html" . }}' ]
# The text body of the email notification.
[ text: <tmpl_string> ]
# Further headers email header key/value pairs. Overrides any headers
# previously set by the notification implementation.
[ headers: { <string>: <tmpl_string>, ... } ]
实践目标:
1 | global: |
1 | tee alert.rules <<'EOF' |
Tips : 说明一下该 rules 目的是监测 node 是否存活 expr 为 PromQL 表达式验证特定节点 job=”linux_exporter” 是否活着,for 表示报警状态为 Pending 后等待 30s 变成 Firing 状态,一旦变成 Firing 状态则将报警发送到 AlertManager 并且 labels (标签)和 annotations(注释) 对该 alert 添加更多的标识和注解信息。
1 | tee alertmanager.yaml <<'EOF' |
1 | # - 重启容器 |
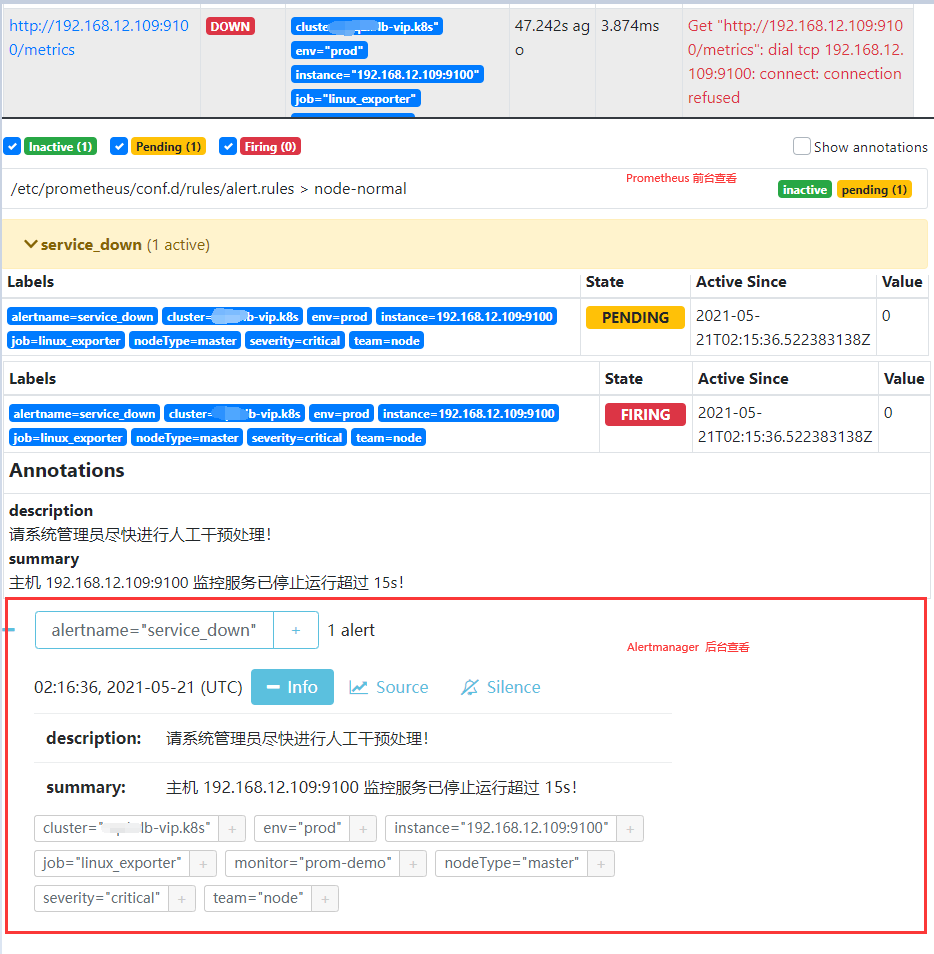
Targets刷新查看linux_exporter任务中状态为 unhealthy 192.168.12.109的节点状态是否变成了DOWN,等待 30s 后,alert 页面由绿色 Service_down (0 active) Inactive 状态变成了黄色 Service_down (1 active) Pending 状态,继续等待 30s 后状态变成红色 Firing 状态,向 AlertManager 发送报警信息,此时 AlertManager 则按照配置规则向接受者发送邮件告警。1 | linux_exporter (5/6 up) |

weiyigeek.top-Alert
Annotations注释信息。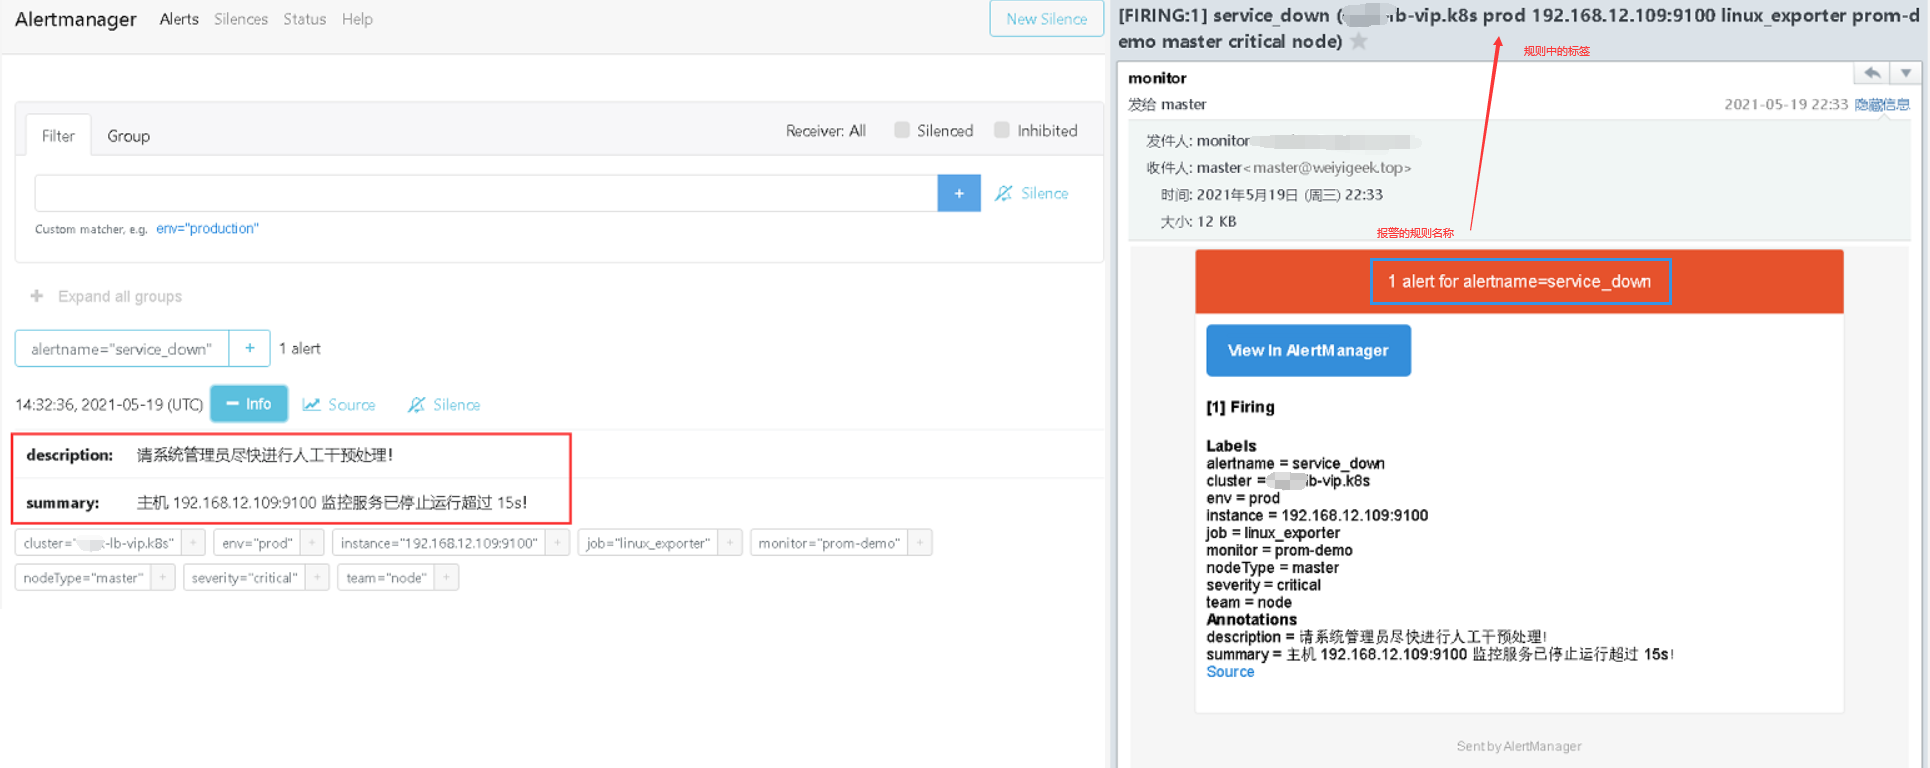
weiyigeek.top-AlertManager-Firing
192.168.12.109机器的linux_exporter服务进行开启查看其恢复以及警报解除情况。在等待 30s 之后,Prometheus Alerts 页面变成绿色 Service_down (0 active) Inactive 状态,同时也收到了报警解除邮件提醒。1 | ssh -p 20211 weiyigeek@weiyigeek-109 "sudo -S systemctl start node_exporter.service" |
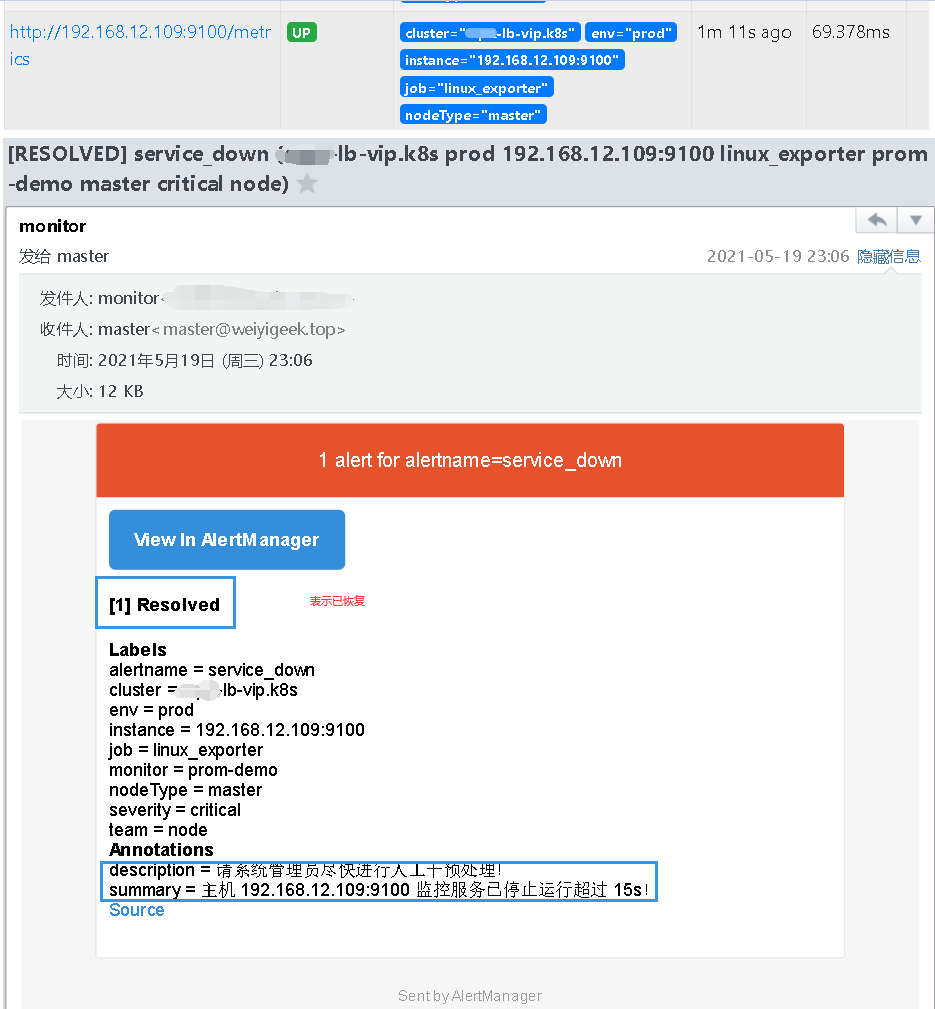
weiyigeek.top-AlertManager-Resolved
Tips : 每次停止/恢复服务后 30s 之后才会发现 Alert 状态变化,是因为 prometheus.yml中 global -> scrape_interval: 30s 配置决定的,如果觉得等待 30s 时间太长,可以修改小一些可以全局修改,也可以局部修改。例如s上面就行采用局部修改 linux_exporter 等待时间为 30s。
描述: 虽然默认的邮件报警样式模板已经包含了所有核心的信息,但是邮件格式内容可以更优雅直观一些,同时AlertManager 也是支持自定义邮件模板配置的。
1 | tee email.tmpl<<'EOF' |
.StartsAt.Format的格式化字符必须是"2006-01-02 15:04:05"(Go 语言诞生的时间我,我们可以简约记2006 1 2 3 4 5),否则报警的时间不对。1 | tee alertmanager.yaml <<'EOF' |
1 | 温馨提示:全局中的邮件参数无法从email.tmpl中读取定义的模板参数,例如{{ template "email.username" .}}坑(排错一下午)只有以下对象可以读取: |
Tips:官方email_config配置参考地址(https://prometheus.io/docs/alerting/latest/configuration/#email_config)
docker restart prometheus_alertmanager, 然后同样停止192.168.12.109的node_exporter服务ssh -p 20211 weiyigeek@weiyigeek-109 "sudo -S systemctl stop node_exporter.service"然后等待prometheus拉取的时间30s,此时为pending状态,再等待30s此时为Firing状态并发送告警邮件,并且在10分钟外如果还收到该报警信息便会再次进行发送。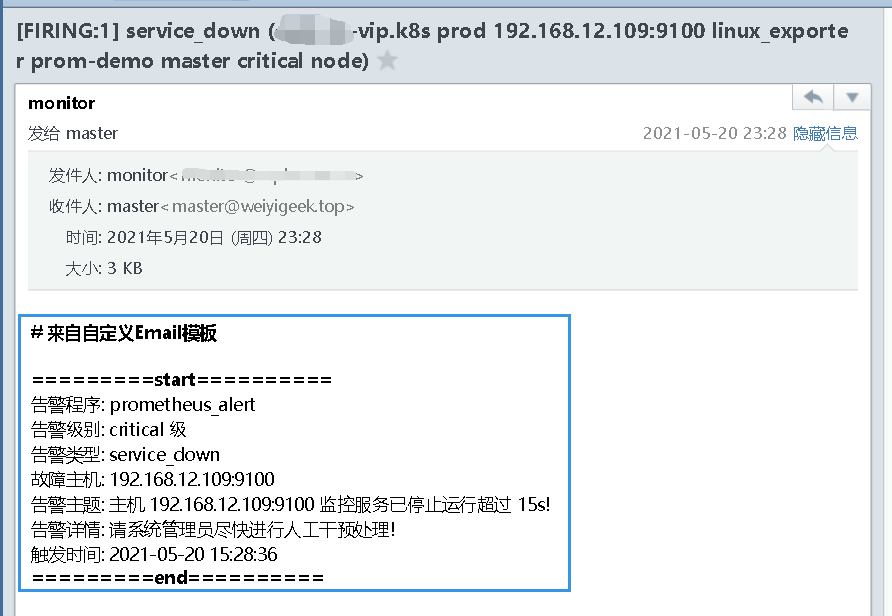
weiyigeek.top-自定义邮件模板
描述: Alertmanager 已经内置了对企业微信的支持,我们可以通过企业微信来管理报警,更进一步可以通过企业微信和微信的互通来直接将告警消息转发到个人微信上,在前面的Alertmanager.yaml配置文件参数进行了解也可以从prometheus的官网 中给出了企业微信的相关配置说明如下:1
2
3
4
5
6
7
8
9
10
11
12
13
14
15
16
17
18
19
20# Whether or not to notify about resolved alerts.
[ send_resolved: <boolean> | default = false ]
# The WeChat API URL.
[ api_url: <string> | default = global.wechat_api_url ]
# 企业微信账号唯一 ID, 可以在我的企业中查看。
[ corp_id: <string> | default = global.wechat_api_corp_id ]
# 第三方企业应用的密钥,可以在自己创建的第三方企业应用详情页面查看。
[ api_secret: <secret> | default = global.wechat_api_secret ]
# 第三方企业应用的 ID,可以在自己创建的第三方企业应用详情页面查看。
[ agent_id: <string> | default = '{{ template "wechat.default.agent_id" . }}' ]
# 在后台通讯录查看需要发送的组的部门ID ( PartyID1 | PartyID2)
[ to_party: <string> | default = '{{ template "wechat.default.to_party" . }}' ]
# 发送的成员 @all 表示所有的成员
[ to_user: <string> | default = '{{ template "wechat.default.to_user" . }}' ]
# 发送给特点 tag 标记的,
[ to_tag: <string> | default = '{{ template "wechat.default.to_tag" . }}' ]
#
[ message: <tmpl_string> | default = '{{ template "wechat.default.message" . }}' ]
Tips : 企业微信相关概念说明请参考企业微信API说明,可以在企业微信的后台中建立多个应用,每个应用对应不同的报警分组,由企业微信来做接收成员的划分。
操作流程步骤:
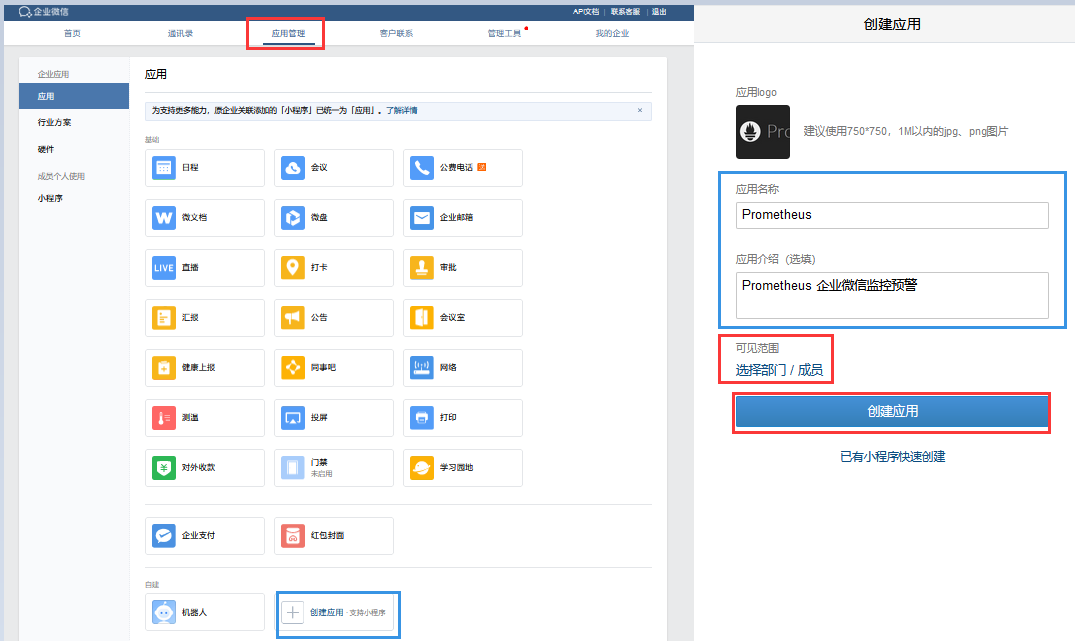
weiyigeek.top-创建自建应用
ID:to_party(需要发送的组),在后面的AlertManager.yml配置文件中使用。1 | # - 例如:博主的AgentId和Secret的格式如下 |
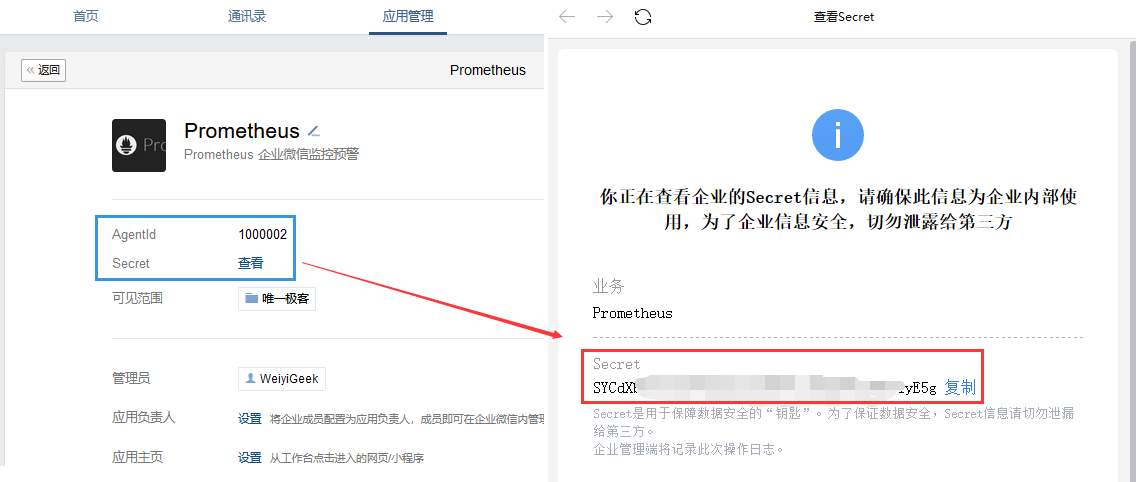
weiyigeek.top-AgentId和Secret
1 | tee alertmanager.yaml <<'EOF' |
docker restart prometheus_alertmanager以后,我们先来查看默认的企业微信报警信息通知。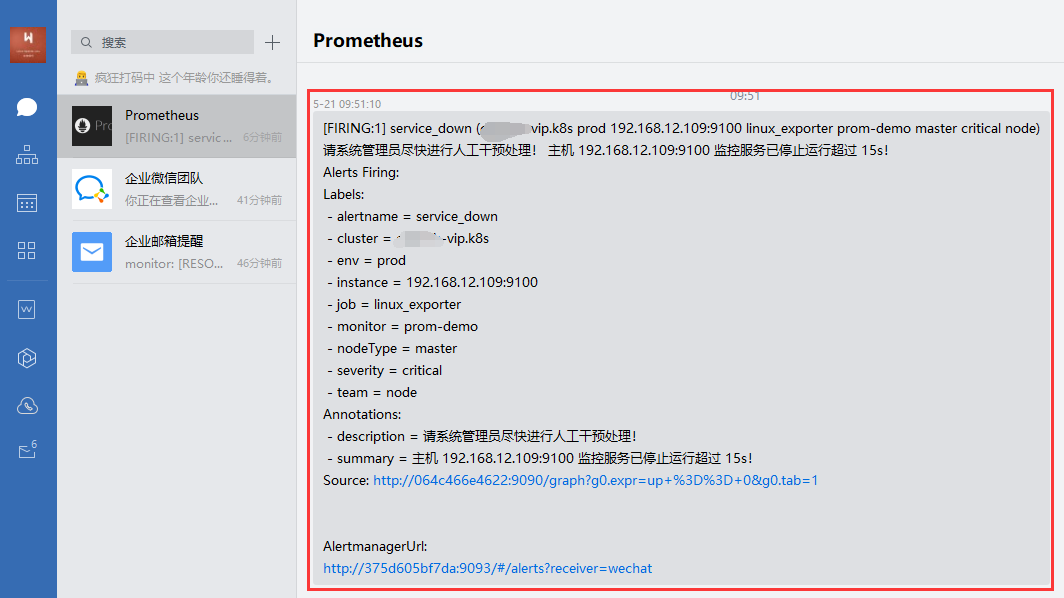
weiyigeek.top-Webchat报警查看
1 | tee wechat.tmpl <<'EOF' |
192.168.12.109机器的node_exporter进行关闭测试模板情况,等待3m将把警告进行发送。1 | # message: '{{ template "wechat.default.message" . }}' |
weiyigeek.top-prometheus&alertmanager
(Alerts.Firing)以及异常恢复(Alerts.Resolved)通知发送结果查看。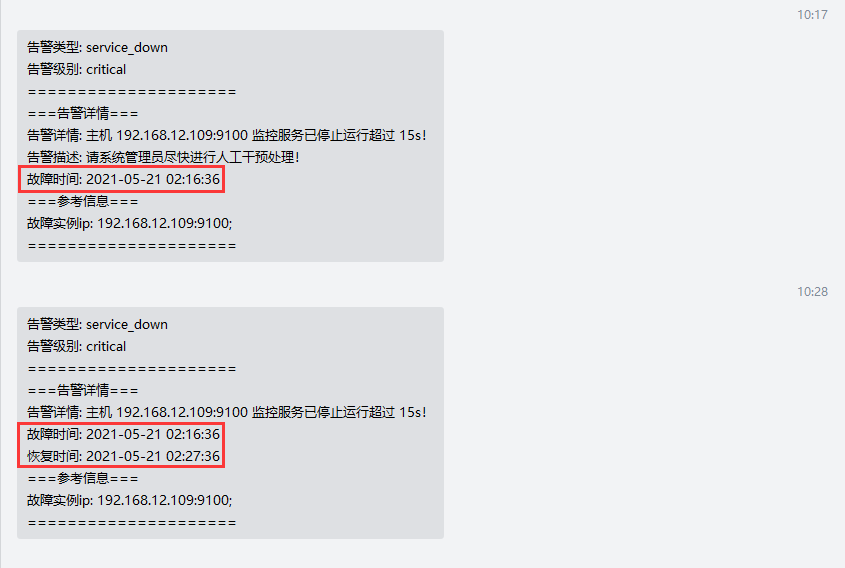
weiyigeek.top-Firing&Resolved
补充说明:
1 | {{ define "wechat.default.message" }} |
描述: 由于 export 并没有提供任何认证支持,所需要借助 Nginx 作为反向代理服务器,添加 HTTP Basic Auth 功能,此时只有授权的用户才能采集监控指标, 可以极大避免未授权访问的情况出现。
操作流程
1 | # 镜像拉取与镜像运行 |
1 | # 拷贝容器中nginx配置 |
1 | # - 容器启动 |
1 | # 启动防火墙 & 查看状态 |
描述: 普罗米修斯监控系统的工具,包含在Prometheus安装包之中。我们可以使用amtool check-config来检查alertmanager.yml文件以及警报查询和Silences。
语法参数:1
2
3
4
5
6
7
8
9
10
11
12
13
14
15
16
17
18
19
20
21
22
23
24
25
26
27
28
29
30usage: promtool [<flags>] <command> [<args> ...]
Flags:
-h, --help Show context-sensitive help (also try --help-long and --help-man).
Commands:
help [<command>...] Show help.
check config <config-files>... # Check if the config files are valid or not.
check web-config <web-config-files>... # Check if the web config files are valid or not.
check rules <rule-files>... # Check if the rule files are valid or not.
check metrics # Pass Prometheus metrics over stdin to lint them for consistency and correctness.
query instant [<flags>] <server> <expr> # Run instant query.
query range [<flags>] <server> <expr> # Run range query.
query series --match=MATCH [<flags>] <server> # Run series query.
query labels [<flags>] <server> <name> # Run labels query.
debug pprof <server> # Fetch profiling debug information.
debug metrics <server> # Fetch metrics debug information.
debug all <server> # Fetch all debug information.
test rules <test-rule-file>... # Unit tests for rules.
tsdb bench write [<flags>] [<file>] # Run a write performance benchmark.
tsdb analyze [<flags>] [<db path>] [<block id>] # Analyze churn, label pair cardinality.
tsdb list [<flags>] [<db path>] # List tsdb blocks.
tsdb dump [<flags>] [<db path>] # Dump samples from a TSDB.
tsdb create-blocks-from openmetrics <input file> [<output directory>] # Import samples from OpenMetrics input and produce TSDB blocks. Please refer to the storage docs for more details.
tsdb create-blocks-from rules --start=START [<flags>] <rule-files>... # Create blocks of data for new recording rules.
基础示例:1
2
3# - 1.验证指标输出是否有效并执行格式检查。
$ cat metrics.prom | promtool check metrics
$ curl -s http://localhost:9090/metrics | promtool check metrics
你好看友,欢迎关注博主微信公众号哟! ❤
这将是我持续更新文章的动力源泉,谢谢支持!(๑′ᴗ‵๑)
温馨提示: 未解锁的用户不能粘贴复制文章内容哟!
方式1.请访问本博主的B站【WeiyiGeek】首页关注UP主,
将自动随机获取解锁验证码。
Method 2.Please visit 【My Twitter】. There is an article verification code in the homepage.
方式3.扫一扫下方二维码,关注本站官方公众号
回复:验证码
将获取解锁(有效期7天)本站所有技术文章哟!

@WeiyiGeek - 为了能到远方,脚下的每一步都不能少
欢迎各位志同道合的朋友一起学习交流,如文章有误请在下方留下您宝贵的经验知识,个人邮箱地址【master#weiyigeek.top】或者个人公众号【WeiyiGeek】联系我。
更多文章来源于【WeiyiGeek Blog - 为了能到远方,脚下的每一步都不能少】, 个人首页地址( https://weiyigeek.top )

专栏书写不易,如果您觉得这个专栏还不错的,请给这篇专栏 【点个赞、投个币、收个藏、关个注、转个发、赞个助】,这将对我的肯定,我将持续整理发布更多优质原创文章!。