
[TOC]
ElasticStack日志采集监控搭建实践案例
|[TOC]
Beats 收集、解析和发送组件
winlogbeat - 简述与使用
描述: 我们可以利用 Winlogbeat 来进行 Windows 日志监视,大致流程是在要监视的每个系统上安装Winlogbeat指定日志文件的位置将日志数据解析为字段并发送到Elasticsearch可视化Kibana中的日志数据。
下载地址: https://www.elastic.co/downloads/beats/winlogbeat
帮助文档: https://www.elastic.co/guide/en/beats/winlogbeat/current/winlogbeat-installation-configuration.html
Tips: 你需要进行提前准备Elasticsearch来存储和搜索你的数据和Kibana来可视化和管理它。
安装流程:
Step 1.从下载页面下载Winlogbeat zip文件,并解压至任意目录此处我解压到
d:\logs\目录之中然后再重命名winlogbeat-<version>目录为Winlogbeat.Step 2.以管理员身份打开PowerShell提示(右键单击PowerShell图标并选择以管理员身份运行). 切换路径并运行以下命令安装服务。
1
2
3
4
5
PS C:\Users\Administrator> cd 'd:\logs\Winlogbeat'
PS d:\logs\Winlogbeat> .\install-service-winlogbeat.ps1
# - 如果系统上禁用了脚本执行,则需要为当前会话设置执行策略以允许脚本运行。
PowerShell.exe -ExecutionPolicy UnRestricted -File .\install-service-winlogbeat.ps1.Step 3.在winlogbeat.yml中设置elasticsearch、kibana连接信息
1
2
3
4
5
6
7
8
9
10
11
12
# 需要连接到Elasticsearch和Kibana才能设置Winlogbeat
# - elasticsearch
output.elasticsearch:
hosts: ["myEShost:9200"]
username: "winlogbeat_internal"
password: "YOUR_PASSWORD"
# - kibana
setup.kibana:
host: "mykibanahost:5601"
username: "my_kibana_user"
password: "{pwd}"
Tips : 我们可以将敏感值存储在secrets密钥库中参考地址。1
2
3
4
5
6
7
8
9
10
11
12
13
14
15
16
17
18# Create a keystore
winlogbeat keystore create
# Add keys (When prompted enter a value for the key.)
winlogbeat keystore add ES_PWD
winlogbeat keystore add ES_PWD --force # To overwrite an existing key’s value
cat /file/containing/setting/value | winlogbeat keystore add ES_PWD --stdin --force
# Successfully updated the keystore
# List keysedit
winlogbeat keystore list
# Remove keysedit
winlogbeat keystore remove ES_PWD
# 例如,假设keystore包含一个名为ES_PWD的密钥,其值为 yourelasticsearchpassword
In the configuration file, use output.elasticsearch.password: "${ES_PWD}"
On the command line, use: -E "output.elasticsearch.password=\${ES_PWD}"
- Step 4.配置Winlogbeatedit在winlogbeat.yml中配置要监视的事件日志。
描述: 在 winlogbeat.event_log下指定要监视的事件日志列表, 默认情况下 Winlogbeat 监视应用程序、安全性和系统日志。1
2
3
4
5
6
7
8
9
10
11
12# - 1.在winlogbeat.event_log下指定要监视的事件日志列表,默认监控 application, security, and system logs 我们可以根据需要进行添加相应事件
winlogbeat.event_logs:
- name: Application
- name: Security
- name: System
# - 2.(可选)设置日志选项以将Winlogbeat日志写入文件:
logging.to_files: true
logging.files:
path: C:\ProgramData\winlogbeat\Logs
logging.level: info
Tips: 我们还可获取可用事件日志的列表 Get-EventLog * 命令1
2
3
4
5
6
7
8
9
10
11Get-EventLog * | Select-Object Log,LogDisplayName
# Log LogDisplayName
# --- --------------
# Application 应用程序
# HardwareEvents 硬件事件
# Internet Explorer Internet Explorer
# Key Management Service 密钥管理服务
# OAlerts Microsoft Office Alerts
# Security
# System 系统
# Windows PowerShell Windows PowerShell
Step 5.保存配置文件后,使用以下命令对其进行测试,并Winlogbeat加载附带用于解析、索引和可视化数据的预定义资产。
1
2
3
4
5
6
7
8
9# 解析验证配置文件
PS d:\logs\Winlogbeat> .\winlogbeat.exe test config -c .\winlogbeat.yml -e
# 加载推荐的索引模板以写入Elasticsearch,并部署示例仪表板以可视化Kibana中的数据。
PS > .\winlogbeat.exe setup -e
# Overwriting ILM policy is disabled. Set `setup.ilm.overwrite: true` for enabling.
# Index setup finished.
# Loading dashboards (Kibana must be running and reachable)
# Loaded dashboardsStep 6.启动服务或者停止服务,然后观察Kibana中主机数据的变化。
1
2Start-Service winlogbeat
Stop-Service winlogbeat
winlogbeat 常用命令
描述: 除了上述的相关命令外,winlogbeat语法参数如下:1
2# - 索引模板加载
PS D:\Pro> Expand-Archive -Path .\winlogbeat-7.14.1-windows-x86_64.zip -DestinationPath .
winlogbeat.yml 语法
参考地址: https://www.elastic.co/guide/en/beats/winlogbeat/current/configuration-winlogbeat-options.html#configuration-winlogbeat-options-event_logs-name
1 | # ==== Winlogbeat specific option ==== |
Tips : 如果指定的事件ID超过22个要包含或排除的事件ID超过22个,Windows将阻止Winlogbeat读取事件日志,因为它限制了事件日志查询中可以使用的条件数。
解决办法:1
2
3
4
5
6
7winlogbeat.event_logs:
- name: Security
processors:
- drop_event.when.not.or:
- equals.winlog.event_id: 903
- equals.winlog.event_id: 1024
- equals.winlog.event_id: 4624
Filebeat - 简述与使用
描述: Filebeat 是一个轻量级的传送器,用于转发和集中日志数据, 该模块收集并解析常见 Unix/Linux 分发的系统日志服务创建的日志。
参考地址: https://www.elastic.co/guide/en/beats/filebeat/current/index.html
Filebeat 工作原理:
- (1) 当您启动 Filebeat 时,它会查看您指定的日志数据位置。
- (2) Filebeat 定位到的每个日志,Filebeat 都会启动一个采集进程。
- (3) 每个 Harvester 读取新内容的单个日志并将新日志数据发送到Fliebeat Spooler(后台服务),并将将聚合数据发送到输出你为 Filebeat 配置的es中。
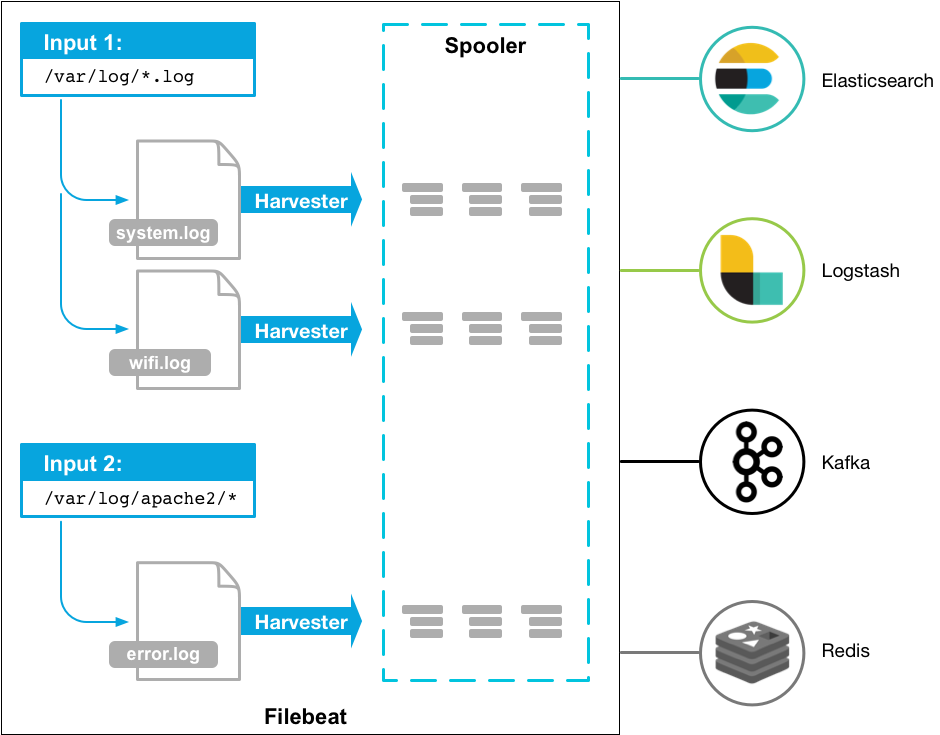
Filebeat-工作流程
Tips: Filebeat is an Elastic Beat. It’s based on the libbeat framework.
Filebeat 安装:
描述: 此处以Linux平台为例进行安装 Filebeat, 如您是其它平台或者采用其它方式(APT/YUM/Docker)则参考以下地址。
参考地址: https://www.elastic.co/guide/en/beats/filebeat/current/filebeat-installation-configuration.html
for i in {78..83};do
ssh -p 20211 10.4.4.${i} ‘wget http://10.4.4.21:8000/filebeatInstall.sh -O /tmp/filebeatInstall.sh && chmod +x /tmp/filebeatInstall.sh && cd /tmp/ && bash -c /tmp/filebeatInstall.sh’
done
for i in {16..20};do
ssh -p 20211 10.41.40.${i} ‘systemctl restart filebeat.service’
done
1 | #!/bin/bash |
入坑出坑
问题1.Kibana无法登陆且在登陆时显示糟糕!错误请重试,后台日志报index ... blocked by: [TOO_MANY_REQUESTS/12/disk usage exceeded flood-stage watermark, index has read-only-allow-delete block]
- 错误日志:
TOO_MANY_REQUESTS/12/disk usage exceeded flood-stage watermark, index has read-only-allow-delete block1
2
3{"type":"log","@timestamp":"2021-10-09T08:01:04+00:00","tags":["error","plugins","security","session","index"],"pid":1213,"message":"Failed to create s
ession value: cluster_block_exception: [cluster_block_exception] Reason: index [.kibana_security_session_1] blocked by: [TOO_MANY_REQUESTS/12/disk usag
e exceeded flood-stage watermark, index has read-only-allow-delete block];"} - 错误原因: 由于ES存储的data磁盘空间使用率已达到95%则将索引设置成为只读模式。
- 解决办法:
1
2
3
4
5
6
7
8
9
10
11
12
13
14
15
16
17
18
19
20# 1.增加磁盘空间大小(操作前注意数据迁移备份)或者删除无用的日志文件
root@elk:~# ls /app/
elastic kibana '#recycle'
root@elk:~# df -Th /app/
Filesystem Type Size Used Avail Use% Mounted on
192.168.2.1:/volume1/share nfs 19T 3.1T 16T 16% /app
# 2.临时在在elasticsearch.yml文件末尾添加以下内容,等等开了进去Kibana后删除无用索引。
# 控制洪水阶段水印最大百分比
cluster.routing.allocation.disk.watermark.flood_stage: 98%
# 根据磁盘使用情况来决定是否继续分配shard
cluster.routing.allocation.disk.threshold_enabled: false
curl -H "Content-Type:application/json" \
-XPUT -u elastic:weiyigeek 'http://log.weiyigeek.top:9200/_cluster/_settings' \
-d '{"transient": {"cluster.routing.allocation.disk.watermark.flood_stage": "99%"}}'
# 3.临时解锁指定Kibana的索引的读写权限(其它索引被锁类似)
curl -H "Content-Type:application/json" -XPUT -u elastic:weiyigeek 'http://log.weiyigeek.top:9200/.kibana_7.14.1_001/_settings' -d '{ "index.blocks.read_only_allow_delete" : null }'
curl -H "Content-Type:application/json" -XPUT -u elastic:weiyigeek 'http://log.weiyigeek.top:9200/.kibana_security_session_1/_settings' -d '{ "index.blocks.read_only_allow_delete" : null }'
X

你好看友,欢迎关注博主微信公众号哟! ❤
这将是我持续更新文章的动力源泉,谢谢支持!(๑′ᴗ‵๑)
温馨提示: 未解锁的用户不能粘贴复制文章内容哟!
方式1.请访问本博主的B站【WeiyiGeek】首页关注UP主,
将自动随机获取解锁验证码。
Method 2.Please visit 【My Twitter】. There is an article verification code in the homepage.
方式3.扫一扫下方二维码,关注本站官方公众号
回复:验证码
将获取解锁(有效期7天)本站所有技术文章哟!
@WeiyiGeek - 为了能到远方,脚下的每一步都不能少
欢迎各位志同道合的朋友一起学习交流,如文章有误请在下方留下您宝贵的经验知识,个人邮箱地址【master#weiyigeek.top】或者个人公众号【WeiyiGeek】联系我。
更多文章来源于【WeiyiGeek Blog - 为了能到远方,脚下的每一步都不能少】, 个人首页地址( https://weiyigeek.top )

专栏书写不易,如果您觉得这个专栏还不错的,请给这篇专栏 【点个赞、投个币、收个藏、关个注、转个发、赞个助】,这将对我的肯定,我将持续整理发布更多优质原创文章!。
最后更新时间:
文章原始路径:_posts/网安防御/安全建设/日志审计/ElasticStack/ElasticStack日志采集监控搭建实践案例.md
转载注明出处,原文地址:https://blog.weiyigeek.top/2021/8-3-651.html
本站文章内容遵循 知识共享 署名 - 非商业性 - 相同方式共享 4.0 国际协议