[TOC]
0x00 前言简述 描述: 最近公司有业务需要搞一个自动化的 jmeter 分布式压力测试项目, 基于现有的 Kubernetes 、Jenkins、 Gitlab 技术栈环境, 本章实践了在 Kubernetes 集群中使用 helm 搭建 jmeter 分布式压力测试 Master 与 server 以及 Influxdb 时序数据库 和 Grafana 环境,在 Windows 中 安装 jmeter 编写带有线程组的压力测试任务,在线程组中利用变量参数传递线程数和循环此处,然后再添加后端监听器设置为influxdb, 针对压力测试数据进行采集, 导出压力测试jmx文件,上传到 Gitlab 创建的 jmeter 仓库中,此处我们已经将Jenkins + Gitlab自动化集成部署已经打通(可以参考下面文章进行相应的学习配置),在上传到 jmeter 代码仓库后将会通过 webhook 请求 jenkins 流水线项目从而触发自动化部署操作,然后Jenkins会使用kubenetes插件在集群中创建一个jenkins slave Pod(插件的使用以及slave 镜像可以在下面实践中获得),之后便会执行流水线中三个步骤即代码拉取、压力测试、结果展示,并且会将部署执行情况通过企业微信提供的webhook发送到指定运维群中,我们可以非常方便点击grafana中 Jmeter 展示数据的 dashboard 地址进行查看 Jmeter 相关压力测试指标数据等,然后针对压力测试数据进行应用和部署环境的调优。
技术栈介绍
Kubernetes : Google 在 2014 年开源了 Kubernetes 项目。 Kubernetes 建立在Google 大规模运行生产工作负载十几年经验,它是一个可移植、可扩展的开源平台,用于管理容器化的工作负载和服务,方便进行声明式配置和自动化。
GitLab : 是一个用于仓库管理系统的开源项目,使用Git作为代码管理工具(类似于 Github),并在此基础上搭建起来的Web服务, 你可以将其认为是在企业中私有化代码仓库。
Jenkins : 一个开源自动化服务器,使世界各地的开发人员能够可靠地构建、测试和部署他们的软件,即 CI/CD 持续集成与交互。
Grafana : 开放、可组合的可观察性和数据可视化平台,可视化来自普罗米修斯(Prometheus)、洛基(Loki)、Elasticsearch、InfluxDB、Postgres等多个来源的度量、日志和跟踪。
Jmeter : 是 Apache 组织基于 Java 开发的压力测试工具,用于对软件做压力测试。
InfluxDB : 是一个开源时间序列平台(数据库), 包括用于存储和查询数据、在后台处理数据以用于 ETL 或监控和警报目的、用户仪表板以及可视化和探索数据等的 API。
好的, 废话不多说实践才是王道。
本章完整原文地址 :
0x01 安装配置 1.基础环境 环境说明 1 2 3 4 5 6 7 8 9 10 11 12 13 14 15 16 $ kubectl get node Java 1.8.0_251 Jmeter 5.4.3 Jenkins 2.330 InfluxDB 1.8.10 Grafana v9.0.2
在K8S集群中部署动态持久卷 描述: 此处使用nfs动态持久卷主要是用于PV/PVC来存放Pod中需要持久化存储的数据。
参考链接: https://blog.weiyigeek.top/2022/6-7-664.html#1-集群中基于nfs的provisioner的动态持卷环境部署
1 2 3 4 5 6 7 8 9 10 11 12 13 14 15 sudo mkdir -vp /storage/dev sudo tee -a /etc/fstab <<'EOF' 192.168.12.32:/k8sdevtest /storage/dev nfs defaults 0 0 EOF sudo mount -a kubectl create ns storage helm install nfs-devtest nfs-subdir-external-provisioner-dev/ --debug --namespace storage kubectl get storageclasses.storage.k8s.io nfs-devtest
在K8S集群中部署压力测试演示站点 1 2 3 4 5 6 7 8 9 10 11 12 13 14 15 16 17 18 19 20 21 22 23 24 25 26 27 28 29 30 31 32 33 34 35 36 37 38 39 40 41 42 43 44 45 46 47 48 49 50 51 52 53 54 55 56 57 58 59 60 61 62 63 64 65 66 67 68 69 70 71 72 73 74 75 76 77 78 79 80 81 82 83 84 85 86 87 88 89 90 91 92 93 94 95 96 97 98 99 100 101 102 103 104 105 106 107 108 109 110 111 112 113 114 115 116 117 118 119 120 121 122 123 124 125 126 127 128 129 130 131 132 133 134 135 136 137 138 139 140 141 142 143 144 145 146 mkdir -vp /nfs/app/web && git https://github.com/WeiyiGeek/WeiyiGeek.git tee /nfs/app/web/nginx.conf <<'EOF' user nginx; worker_processes auto; error_log /var/log /nginx/error.log notice; pid /var/run/nginx.pid; events { worker_connections 1024; } http { include /etc/nginx/mime.types; default_type application/octet-stream; log_format main '$remote_addr - $remote_user [$time_local] "$request" $status $body_bytes_sent "$http_referer" "$http_user_agent" "$http_x_forwarded_for"' ; access_log /var/log /nginx/access.log main; sendfile on; keepalive_timeout 65; gzip on; server { listen 80; listen [::]:80; server_name localhost; location / { root /usr/share/nginx/html; index index.html index.htm; } } } EOF kubectl create cm nginx-conf --from-file=nginx.conf --namespace devtest tee /nfs/app/web/jmeter-test-html.yaml <<'EOF' apiVersion: apps/v1 kind: StatefulSet metadata: name: jmeter-test-html namespace: devtest labels: app: web-html spec: replicas: 1 selector: matchLabels: app: web-html serviceName: "jmeter-test-html" template: metadata: labels: app: web-html spec: volumes: - name: workdir emptyDir: {} - name: static-file hostPath: path: /nfs/app/web/WeiyiGeek type : DirectoryOrCreate - name: nginx-conf configMap: name: nginx-conf items: - key: nginx.conf path: nginx.conf - name: timezone hostPath: path: /usr/share/zoneinfo/Asia/Shanghai initContainers: - name: sysctl image: alpine:3.15.4 imagePullPolicy: IfNotPresent command : - sh - -c - | mount -o remount rw /proc/sys sysctl -w net.core.somaxconn=65535 sysctl -w net.ipv4.tcp_tw_reuse=1 sysctl -w net.ipv4.ip_local_port_range="1024 65535" sysctl -w fs.file-max=1048576 sysctl -w fs.inotify.max_user_instances=16384 sysctl -w fs.inotify.max_user_watches=524288 sysctl -w fs.inotify.max_queued_events=16384 securityContext: privileged: true containers: - name: nginx image: nginx:1.21.6 imagePullPolicy: IfNotPresent ports: - name: http protocol: TCP containerPort: 80 volumeMounts: - name: static-file mountPath: /usr/share/nginx/html - name: nginx-conf mountPath: /etc/nginx/nginx.conf subPath: nginx.conf --- apiVersion: v1 kind: Service metadata: name: jmeter-test-html namespace: devtest spec: type : nodePort ports: - port: 80 targetPort: 80 protocol: TCP nodePort: 32644 selector: app: web-html EOF kubectl apply -f jmeter-test-html.yaml $ kubectl get svc -n devtest jmeter-test-html $ curl -s 10.103.88.2
温馨提示: 如有同道之人在进行实践时,请更改上述文件目录为您实际存放静态资源以及nginx配置的目录。
2.依赖环境 在 Windows 中安装 Apache jmeter 工具 描述: 此处针对于Windows中安装JAVA环境以及 Apache jmeter不在累述, 如果不会安装的同学可以参考 (1.使用Apache Jmeter对应用压力测试学习与实践)[https://blog.weiyigeek.top/2022/6-11-661.html#Windows] 这篇文章或者参考Apache jmeter的官网。
以二进制方式安装Helm部署工具 快速部署 1 2 3 4 5 ARCH=$(dpkg --print -architecture) VERSION="3.8.2" wget https://get.helm.sh/helm-v${VERSION} -linux-${ARCH} .tar.gz -O /tmp/helm-v${VERSION} -linux-${ARCH} .tar.gz cd /tmp/ && tar -zxf helm-v${VERSION} -linux-${ARCH} .tar.gzsudo cp linux-amd64/helm /usr/local /bin/
以 helm 方式安装 Grafana 9.x 快速部署 1 2 3 4 5 6 7 8 9 10 11 12 13 14 15 16 17 18 $ helm repo add grafana https://grafana.github.io/helm-charts $ helm repo update $ helm search repo grafana $ helm show values grafana/grafana --version 6.32.3 > granfa-values.yaml $ helm install grafana grafana/grafana --version 6.32.3 --set nodeSelector="kubernetes\.io/hostname=node-223" ,service.type=NodePort,persistence.enabled=True,persistence.storageClassName="persistentVolumeClaim" ,persistence.size=5Gi,persistence.accessModes=ReadWriteOnce -n dashboard --debug --create-namespace kubectl get secrets -n devops grafana -o yaml echo "RlJLMkR1bmlpalY2YXRMcGtuU053NmhLanRibnhZZUZRY25tV0ZtSg==" | base64 -d$ helm delete grafana
0x02 Kubernetes + jmeter + InfluxDB 1.8.x + Grafana + Jenkins 进行自动化分布式压力测试及其结果展示 (1) 以 helm 方式安装分布式 jmeter 压力测试应用 快速部署
1 2 3 4 5 6 7 8 9 10 11 12 13 14 15 16 17 18 19 20 21 22 23 24 25 26 27 28 29 30 31 32 33 34 35 36 37 38 39 40 41 42 43 44 45 46 47 48 49 50 51 52 53 $ helm repo add apphub https://apphub.aliyuncs.com/ $ helm repo update $ helm search repo jmeter $ helm show values apphub/distributed-jmeter --version 1.0.1 > distributed-jmeter.yaml $ cat distributed-jmeter.yaml master: replicaCount: 1 server: replicaCount: 3 image: pullPolicy: IfNotPresent repository: "pedrocesarti/jmeter-docker" tag: 3.2 $ helm install jmeter apphub/distributed-jmeter -f distributed-jmeter.yaml --namespace devtest --create-namespace $ export MASTER_NAME=$(kubectl get pods -l app.kubernetes.io/component=master -o jsonpath='{.items[*].metadata.name}' -n devtest ) $ kubectl -n devtest exec -it $MASTER_NAME -- /bin/bash $ kubectl -n devtest cp sample.jmx $MASTER_NAME :/jmeter $ export SERVER_IPS=$(kubectl get pods -l app.kubernetes.io/component=server -o jsonpath='{.items[*].status.podIP}' -n devtest | tr ' ' ',' ) $ kubectl exec -it $MASTER_NAME -- jmeter -n -t /jmeter/sample.jmx -R $SERVER_IPS $ kubectl get deployments.apps,pod,svc -n devtest -l app.kubernetes.io/name=distributed-jmeter
手动测试部署环境 jmeter-test.jmx 任务。
weiyigeek.top-jmeter-test.jmx
步骤 02.将jmeter中测试任务导出到jmeter-test.jmx文件中,并复制到 Master 节点容器中,然后执行分布式压力测试命令。1 2 3 4 5 6 7 8 9 10 11 12 13 14 15 16 17 18 19 20 21 22 23 24 export MASTER_NAME=$(kubectl get pods -l app.kubernetes.io/component=master -o jsonpath='{.items[*].metadata.name}' -n devtest )export SERVER_IPS=$(kubectl get pods -l app.kubernetes.io/component=server -o jsonpath='{.items[*].status.podIP}' -n devtest | tr ' ' ',' )kubectl -n devtest cp ./jmeter-test.jmx ${MASTER_NAME} :/jmeter/jmeter-test.jmx kubectl -n devtest exec -it $MASTER_NAME -- jmeter -Jgroup.threads=5 -Jgroup.loops=20 -n -t /jmeter/jmeter-test.jmx -l jmeter-test.result -R $SERVER_IPS kubectl -n devtest exec -it $MASTER_NAME -- jmeter -Ggroup.threads=20 -Ggroup.loops=20 -n -t /jmeter/jmeter-test.jmx -l jmeter-test.result -R $SERVER_IPS
(2) 以资源清单方式安装配置 InfluxDB 1.8 时序数据库 快速安装
步骤 01.准备influxdb使用的配置文件并存放到configMap资源控制器下。1 2 3 4 5 6 7 8 9 10 11 12 13 14 15 16 17 18 19 20 21 22 23 24 25 26 27 28 29 30 31 32 33 34 35 36 37 38 39 40 41 42 43 44 45 46 47 48 49 50 51 52 53 54 55 56 57 58 59 60 61 62 63 64 65 66 67 68 69 70 71 72 73 74 75 76 mkdir -vp /storage/dev/webapp/database/jmeter-influxdb tee /storage/dev/webapp/database/jmeter-influxdb/influxdb.conf <<'EOF' [meta] dir = "/var/lib/influxdb/meta" retention-autocreate = true logging-enabled = true [data] dir = "/var/lib/influxdb/data" index-version = "inmem" wal-dir = "/var/lib/influxdb/wal" wal-fsync-delay = "0s" [coordinator] write-timeout = "10s" max-concurrent-queries = 0 query-timeout = "0s" log -queries-after = "0s" max-select-point = 0 max-select-series = 0 max-select-buckets = 0 [retention] enabled = true check-interval = "30m0s" [monitor] store-enabled = true store-database = "_internal" store-interval = "10s" [subscriber] enabled = true http-timeout = "30s" insecure-skip-verify = false ca-certs = "" write-concurrency = 40 write-buffer-size = 1000 [shard-precreation] enabled = true check-interval = "10m0s" advance-period = "30m0s" [http] enabled = true bind -address = ":8086" [logging] format = "auto" level = "info" suppress-logo = false [[graphite]] enabled = true bind -address = ":2003" database = "jmeter" retention-policy = "" protocol = "tcp" batch-size = 5000 batch-pending = 10 batch-timeout = "1s" consistency-level = "one" separator = "." udp-read-buffer = 0 [continuous_queries] log -enabled = true enabled = true query-stats-enabled = false run-interval = "1s" EOF $ cd /storage/dev/webapp/database/jmeter-influxdb $ kubectl create cm influxdb-config --from-file=influxdb.conf --namespace database
步骤 02.准备使用Deployment资源控制器部署jmeter-influxDB1.x相关的资源清单如下:1 2 3 4 5 6 7 8 9 10 11 12 13 14 15 16 17 18 19 20 21 22 23 24 25 26 27 28 29 30 31 32 33 34 35 36 37 38 39 40 41 42 43 44 45 46 47 48 49 50 51 52 53 54 55 56 57 58 59 60 61 62 63 64 65 66 67 68 69 70 71 72 73 74 75 76 77 78 79 80 81 82 83 84 85 86 87 88 89 90 91 92 tee influxdb-Deployment.yaml <<'EOF' apiVersion: v1 kind: PersistentVolumeClaim metadata: name: jmeter-influxdb-pvc namespace: database labels: app: jmeter-influxdb spec: storageClassName: nfs-devtest accessModes: - ReadWriteOnce resources: requests: storage: 2Gi --- apiVersion: v1 kind: Service metadata: name: jmeter-influxdb namespace: database labels: app: jmeter-influxdb spec: ports: - name: api nodePort: 32086 port: 8086 protocol: TCP targetPort: 8086 - name: graphite nodePort: 32003 port: 2003 protocol: TCP targetPort: 2003 selector: app: jmeter-influxdb sessionAffinity: None type : NodePort --- apiVersion: apps/v1 kind: Deployment metadata: name: jmeter-influxdb namespace: database labels: app: jmeter-influxdb spec: replicas: 1 selector: matchLabels: app: jmeter-influxdb template: metadata: labels: app: jmeter-influxdb spec: containers: - image: influxdb:1.8.10 imagePullPolicy: IfNotPresent name: influxdb ports: - containerPort: 8086 name: api protocol: TCP - containerPort: 2003 name: graphite protocol: TCP volumeMounts: - mountPath: /etc/influxdb/influxdb.conf name: config subPath: influxdb.conf - mountPath: /var/lib/influxdb name: data restartPolicy: Always terminationGracePeriodSeconds: 30 volumes: - name: config configMap: defaultMode: 420 name: influxdb-config items: - key: influxdb.conf path: influxdb.conf - name: data persistentVolumeClaim: claimName: jmeter-influxdb-pvc EOF
步骤 03.使用kubectl工具按照influxdb-Deployment.yaml资源清单中的内容进行安装部署, 并且查看其部署情况。1 2 3 4 5 6 7 8 9 10 11 12 13 14 15 16 17 18 19 20 21 22 23 24 $ kubectl apply -f influxdb-Deployment.yaml $ kubectl get pod,svc,pvc -n database -l app=jmeter-influxdb kubectl port-forward --namespace database $(kubectl get pods --namespace database -l app=jmeter-influxdb -o jsonpath='{ .items[0].metadata.name }' ) 8086:8086 kubectl exec -i -t --namespace database $(kubectl get pods --namespace database -l app=jmeter-influxdb -o jsonpath='{.items[0].metadata.name}' ) /bin/bash kubectl logs -f --namespace database $(kubectl get pods --namespace database -l app=jmeter-influxdb -o jsonpath='{ .items[0].metadata.name }' )
步骤 04.进入 jmeter-influxdb pod 的 shell 终端中创建 jmeter 所使用的用户及其数据库。
1 2 3 4 5 6 7 8 9 10 11 12 13 14 15 16 17 18 19 20 21 22 23 24 25 26 27 28 29 30 31 32 33 34 35 36 37 38 39 40 41 42 43 44 45 46 47 48 49 $ kubectl exec -i -t --namespace database $(kubectl get pods --namespace database -l app=jmeter-influxdb -o jsonpath='{.items[0].metadata.name}' ) /bin/bash root@influxdb-f54d77bc6-cp46r:/ Connected to http://localhost:8086 version 1.8.10 InfluxDB shell version: 1.8.10 > help Usage: connect <host:port> connects to another node specified by host:port auth prompts for username and password pretty toggles pretty print for the json format chunked turns on chunked responses from server chunk size <size> sets the size of the chunked responses. Set to 0 to reset to the default chunked size use <db_name> sets current database format <format> specifies the format of the server responses: json, csv, or column precision <format> specifies the format of the timestamp: rfc3339, h, m, s, ms, u or ns consistency <level> sets write consistency level: any, one, quorum, or all history displays command history settings outputs the current settings for the shell clear clears settings such as database or retention policy. run 'clear' for help exit /quit/ctrl+d quits the influx shell show databases show database names show series show series information show measurements show measurement information show tag keys show tag key information show field keys show field key information > settings Setting Value -------- -------- URL http://localhost:8086 Username Database RetentionPolicy Pretty false Format column Write Consistency all Chunked true Chunk Size 0 CREATE USER "jmeter" WITH PASSWORD 'weiyigeek.top' WITH ALL PRIVILEGES CREATE DATABASE jmeter SHOW DATABASES USE jmeter SHOW MEASUREMENTS exit
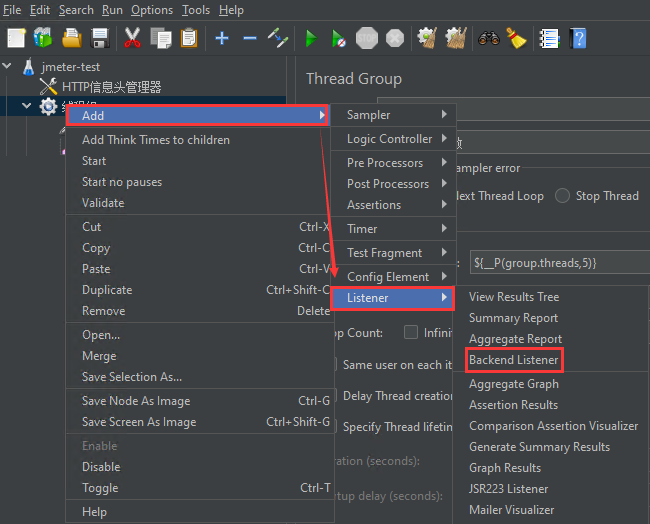
(3) 在 jmeter 中添加 Backend Listener 配置 influxDB 相关信息 操作步骤
weiyigeek.top-add Backend Listener
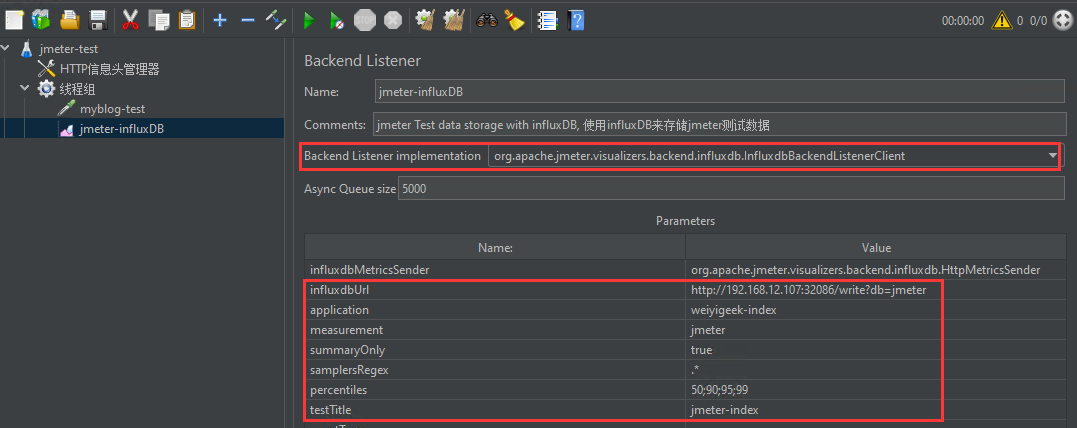
步骤 02.在 Name 处输入 jmeter-influxDB 名称 , 在 Backend Listener implementation 中下拉选中( org.apache.jmeter.visualizers.backend.influxdb.influxdbBackendListenerClient ) , 其配置如下所示:1 2 3 4 5 6 7 8 9 influxdbMetricsSender org.apache.jmeter.visualizers.backend.influxdb.HttpMetricsSender influxdbUrl http://192.168.12.107:32086/write?db=jmeter application weiyigeek-index measurement jmeter summaryOnly true samplersRegex .* percentiles 50;90;95;99 testTitle jmeter-index eventTags
weiyigeek.top-Configure Backend Listener
温馨提示: influxdbUrl 此处采用了 nodePort 暴露的端口
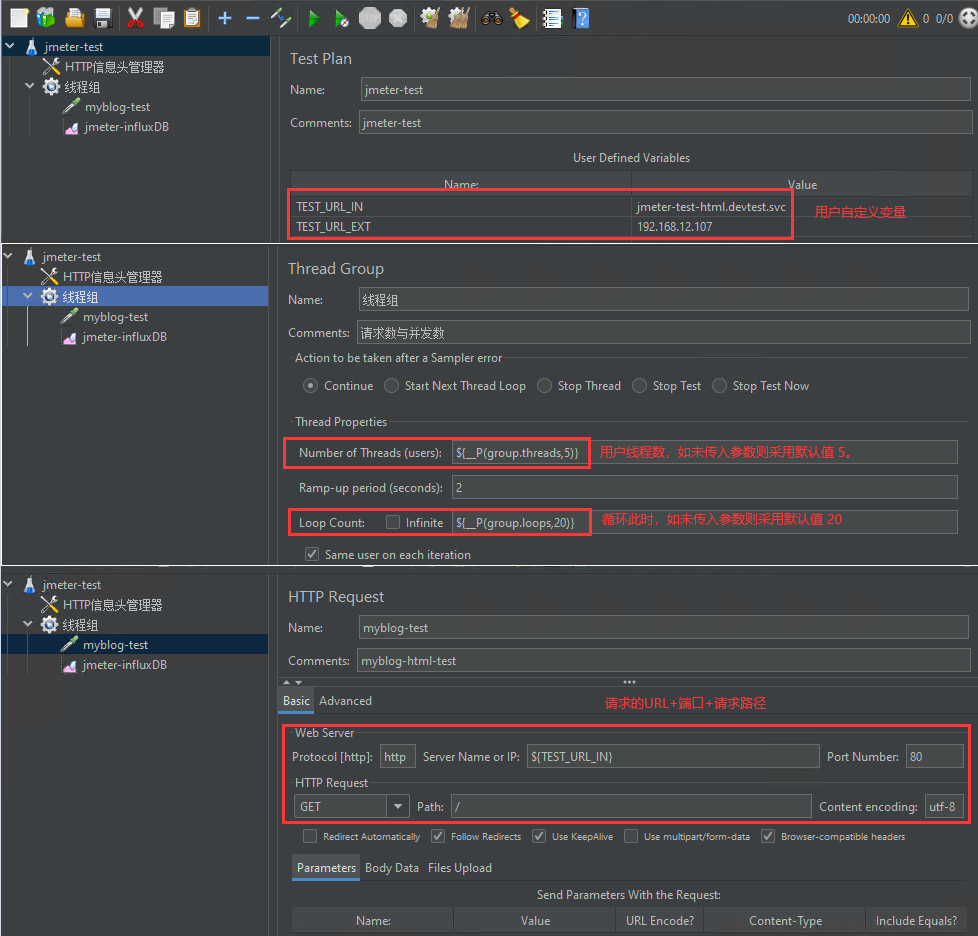
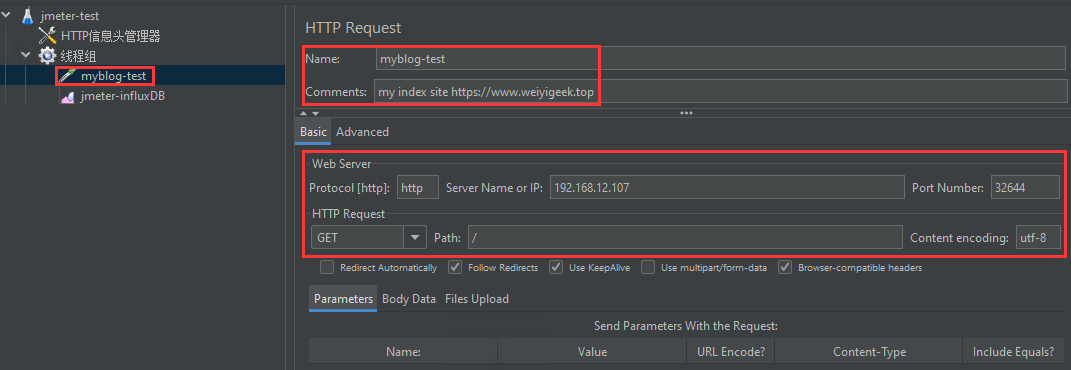
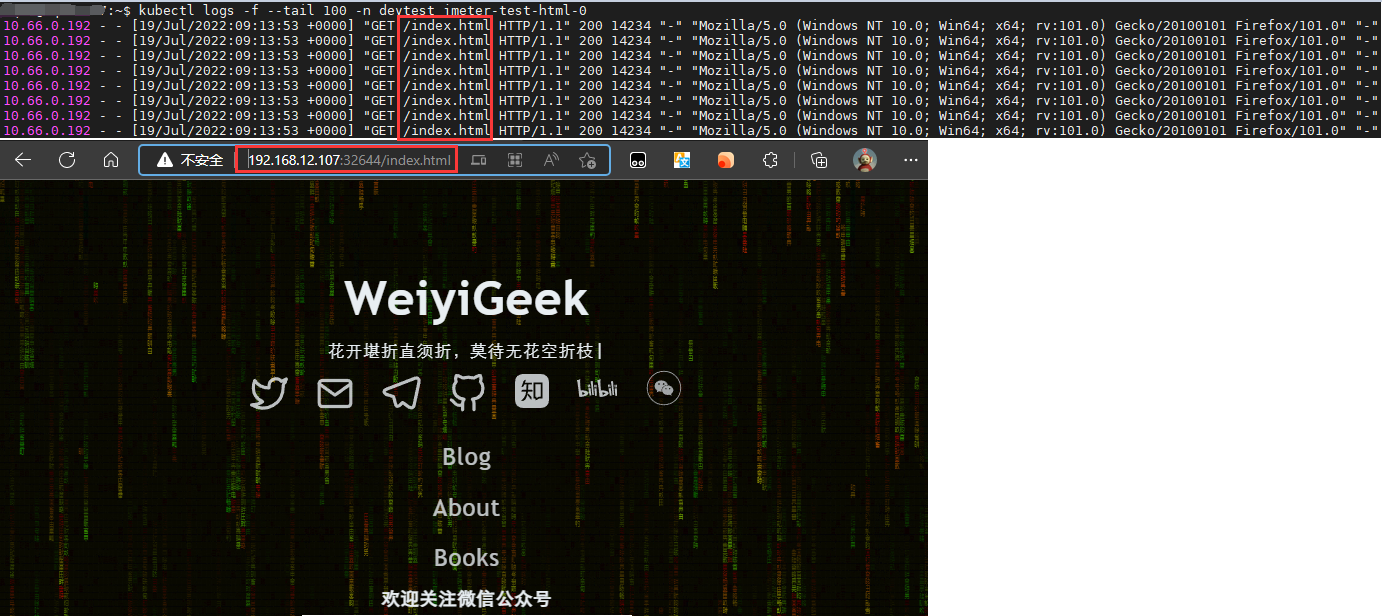
步骤 03.在线程组中添加一个HTTP-Request请求,将上面我们搭建演示压力测试的站点信息进行填入。1 2 3 4 5 6 7 8 Name: myblog-test Comments: 备注可以自定义 Protocol: http Server NAME or IP: 192.168.12.107 Port Number: 32644 HTTP Request: GET Path: /index.html Content encoding: utf-8
weiyigeek.top-Configure HTTP Request
温馨提示:此处压力测试地址实际就是(http://192.168.12.107:32644/index.html) .
步骤 04.配置完成后点击菜单栏中 《绿色start》 的按钮开始压力测试任务,请求 100 次 (此处缺省 5 线程 循环 20 ), 然后可以通过kubectl logs -f --tail 100 -n devtest jmeter-test-html-0命令查看到jmeter请求该路径的访问日志。
weiyigeek.top-
步骤 05.查看后端监听器配置influxdb数据中采集到的数据。1 2 3 4 5 6 7 8 9 10 11 12 13 14 15 16 17 18 19 20 21 22 23 24 25 26 kubectl exec -i -t --namespace database $(kubectl get pods --namespace database -l app=jmeter-influxdb -o jsonpath='{.items[0].metadata.name}' ) /bin/bash -- influx Connected to http://localhost:8086 version 1.8.10 InfluxDB shell version: 1.8.10 > use jmeter Using database jmeter > SHOW MEASUREMENTS name: measurements name ---- events jmeter > select * from jmeter; name: jmeter time application avg count countError endedT hit max maxAT meanAT min minAT pct50.0 pct90.0 pct95.0 pct99.0 rb sb startedT statut transaction ---- ----------- --- ----- ---------- ------ --- --- ----- ------ --- ----- ------- ------- ------- ------- -- -- -------- ------ ----------- 1658221734017000000 weiyigeek-index 0 0 0 0 0 internal 1658221735666000000 weiyigeek-index 2.09 100 0 100 24 1 2 2 3.8999999999999773 23.799999999999898 1447500 16400 all all 1658221735667000000 weiyigeek-index 5 1 0 0 5 internal > select * from events; name: events time application text title ---- ----------- ---- ----- 1658221734002000000 weiyigeek-index jmeter-index started ApacheJMeter 1658221735666000000 weiyigeek-index jmeter-index ended ApacheJMeter
(4) 在 grafana 中展示 jmeter 压力测试相关指标数据。
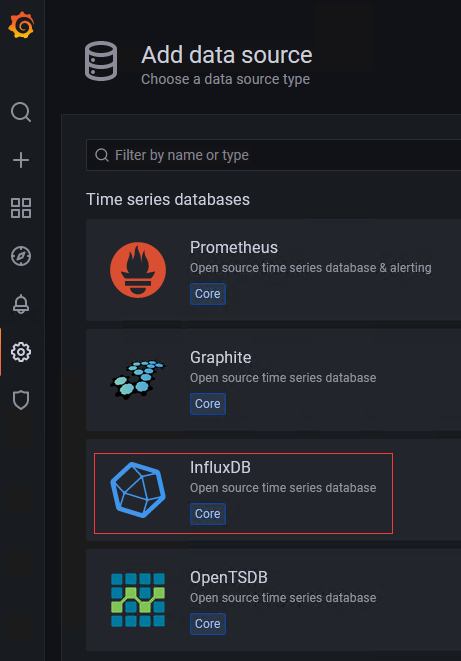
步骤 01.登陆Grafana之后需要新增数据源(Add your first data source),此处当然选择InfluxDB时间序列数据库源。
weiyigeek.top-添加 InfluxDB 数据源
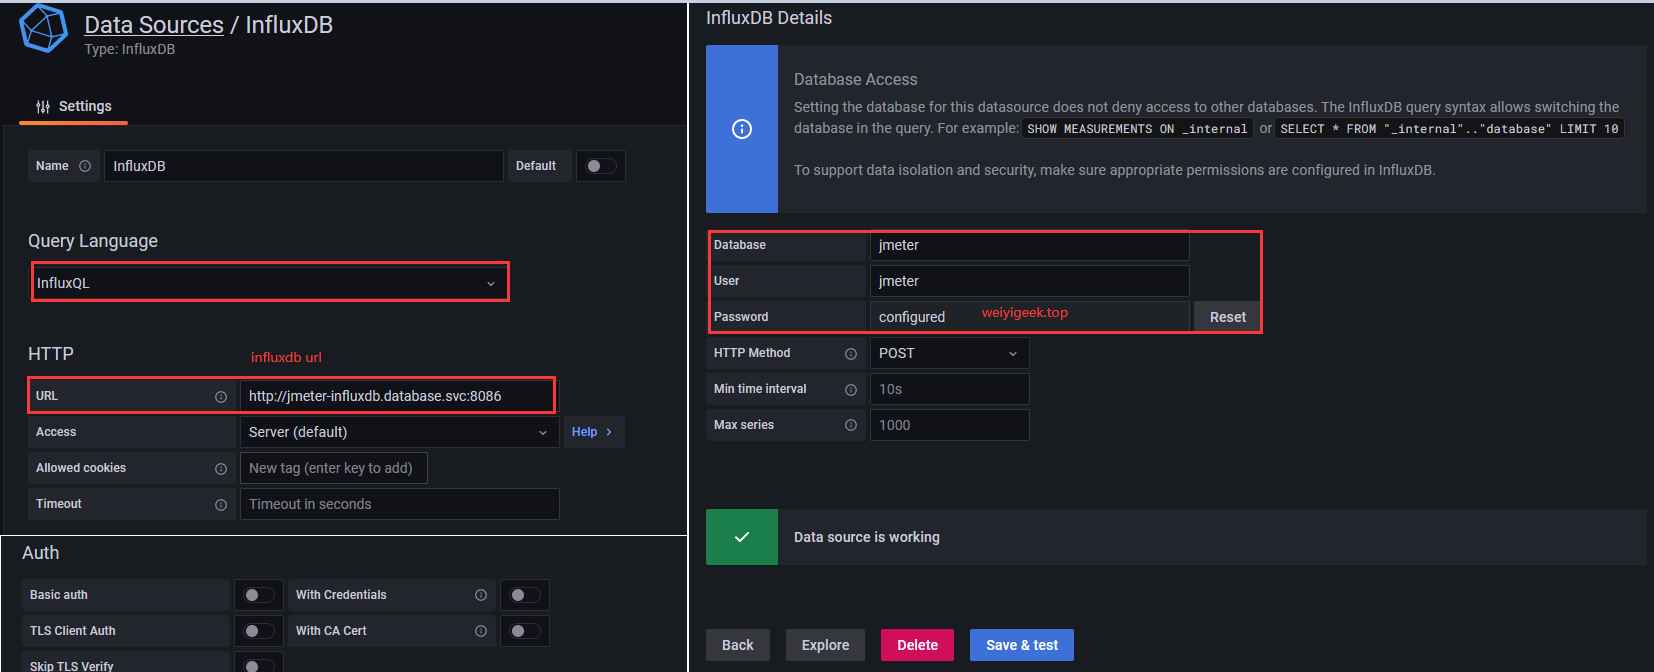
步骤 02.选择后将会出现如下界面, 需要按照实际情况进行填写, 其中最重要的是influxdb相关连接数据库认证信息(jmeter、jmeter、weiyigeek.top), 填写无误后点击 Save&Test, 如测试成功将会显示Data source is working。
温馨提示: 此处 influxdb url 填入的是 (http://jmeter-influxdb.database.svc:8086 ) 即服务名称加SVC端口,当然你也可以填写节点IP+nodePort端口即(http://192.168.12.107:32086/ )
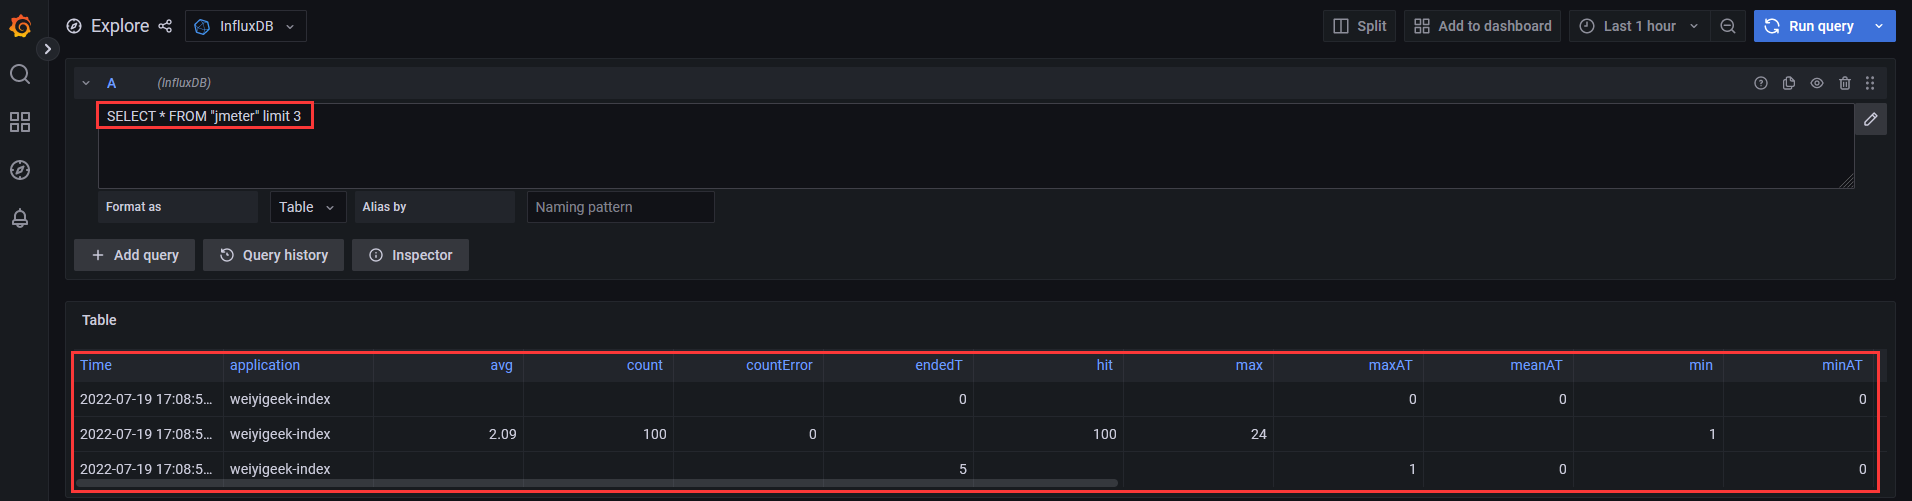
步骤 03.然后可以点击步骤02页面上的Explore,执行如下sql:SELECT * FROM "jmeter" limit 3进行查询到jmeter压力测试的数据。
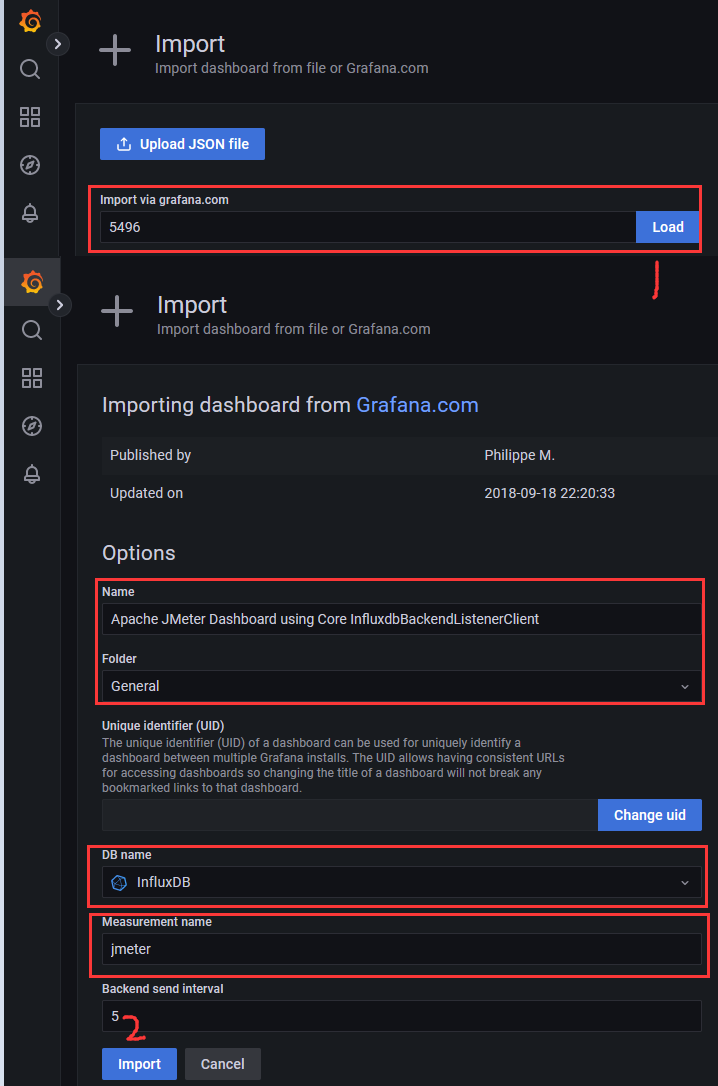
weiyigeek.top-InfluxDB Explore
weiyigeek.top-Apache JMeter Dashboard using Core InfluxdbBackendListenerClient
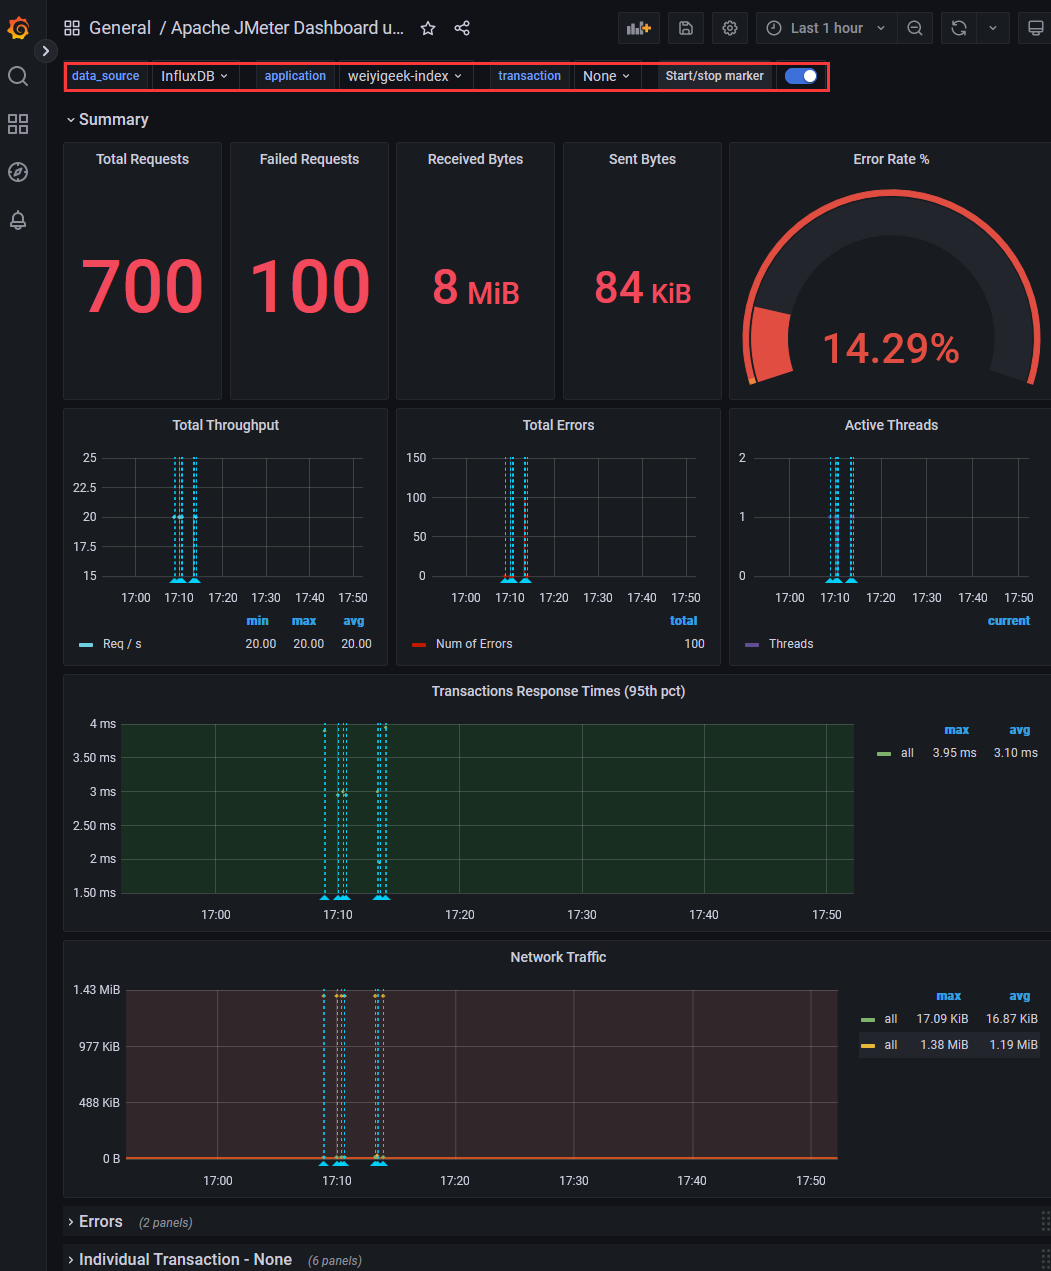
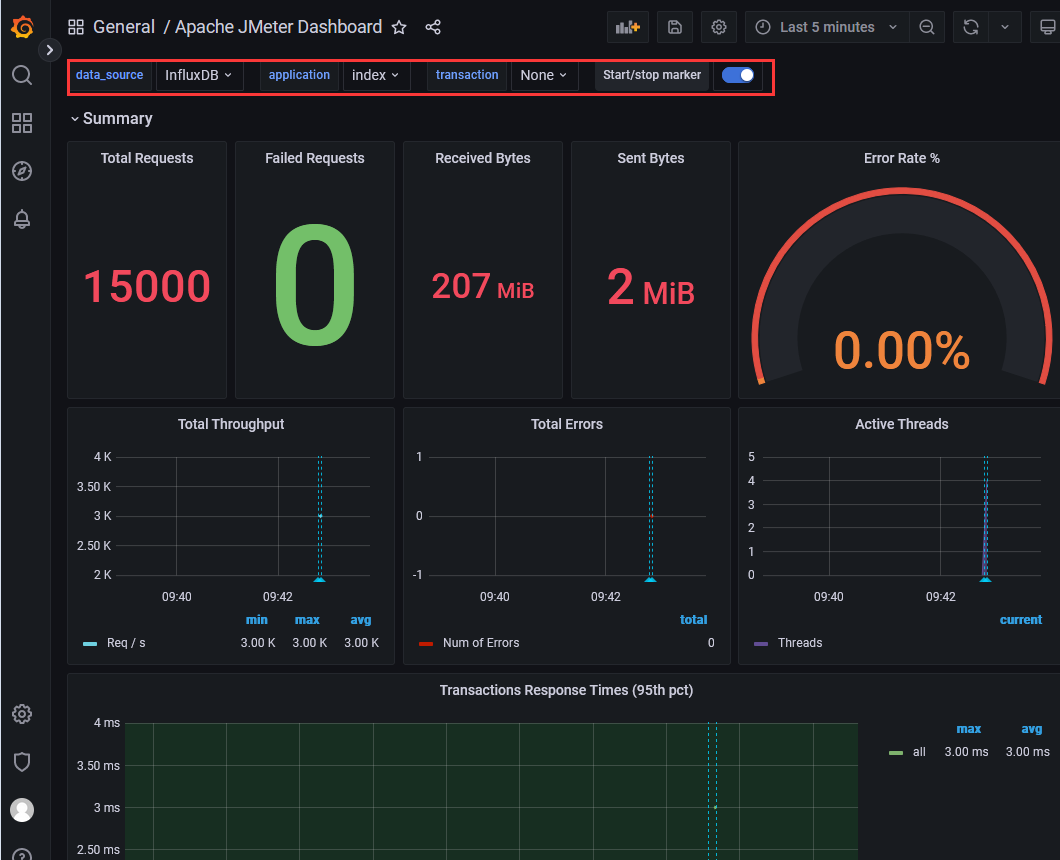
步骤 05.导入后我们便可在 Grafana 首页中查看到该 Dashboard, 我们点击进入查看该展板显示的 Jmeter 压力测试的数据。
weiyigeek.top-Apache JMeter Dashboard
(5) 使用 kubernetes + Gitlab + Jenkins + Grafana 实现自动化分布式压力测试数据展示实践 实践流程:
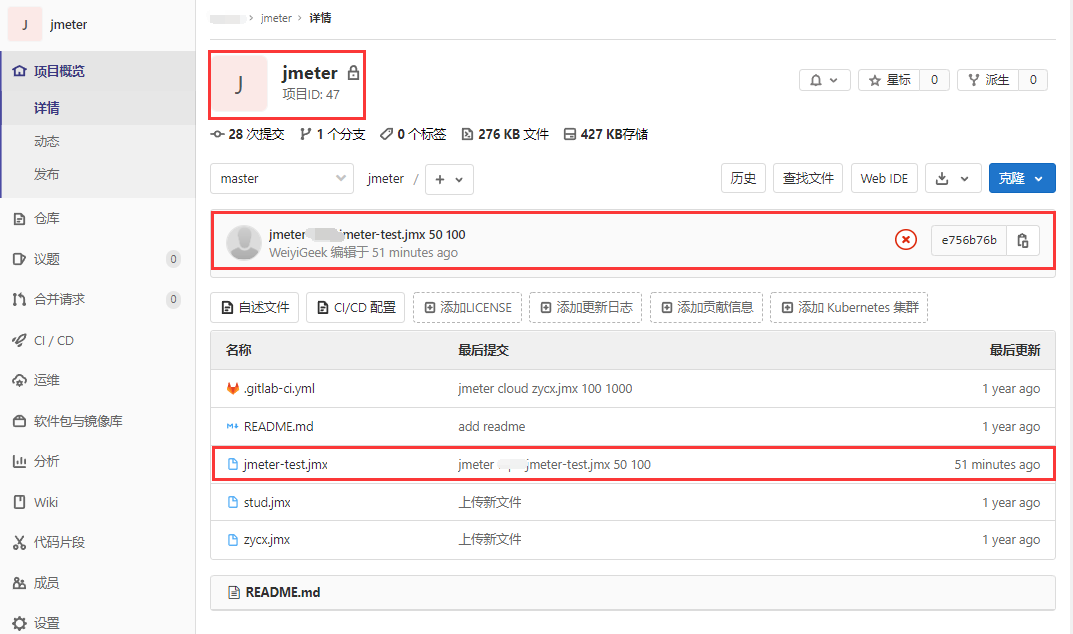
weiyigeek.top-Jmeter 仓库
温馨提示: Gitlab 的安装此处不进行展开讲解, 如有需要安装实践的童鞋可以参考我的这篇文章 [GitLab企业级私有代码仓库安装与基础使用] (https://blog.weiyigeek.top/2019/7-22-98.html ) 或者 gitlab 官方安装文档 (https://about.gitlab.com/install/)。
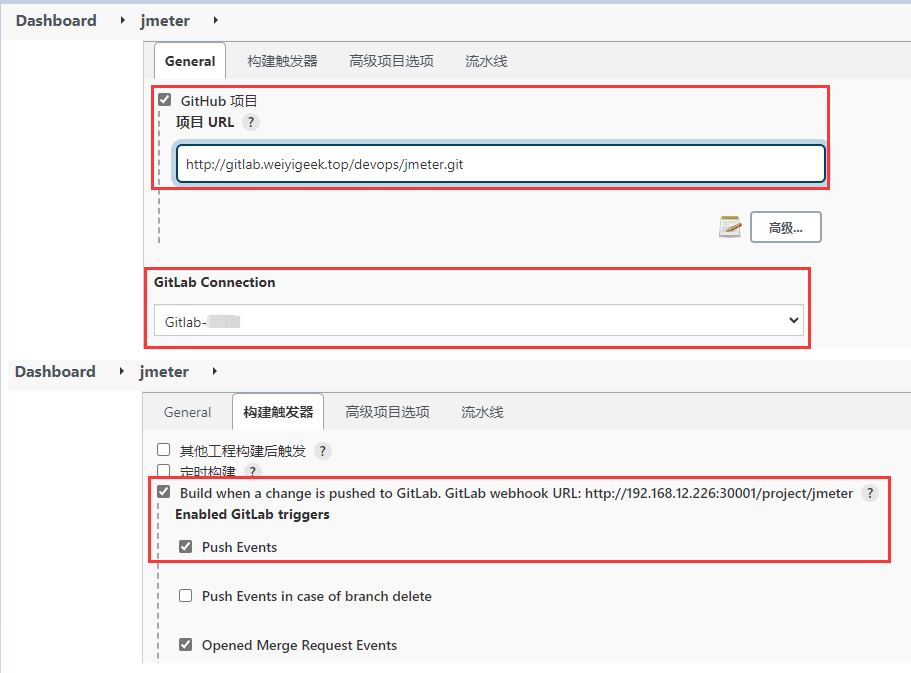
步骤 02.在 Jenkins 中创建一个名为 Jmeter 流水线的任务,然后再进行如下配置:
(1) 勾选 GitHub 项目 -> 输入Jmeter项目地址 (http://gitlab.weiyigeek.top/devops/jmeter.git )
(2) 在 GitLab Connection 下拉框中选择 Gitlab-Auth 认证的票据 (其生成可以参考下面温馨提示中的文章)
(3) 构建触发器选项卡中勾选 Enabled GitLab triggers.http://192.168.12.226:30001/project/jmeter
温馨提示: Jenkins 的相关安装部署请参考我的博客文章 《https://blog.weiyigeek.top/tags/Jenkins/》
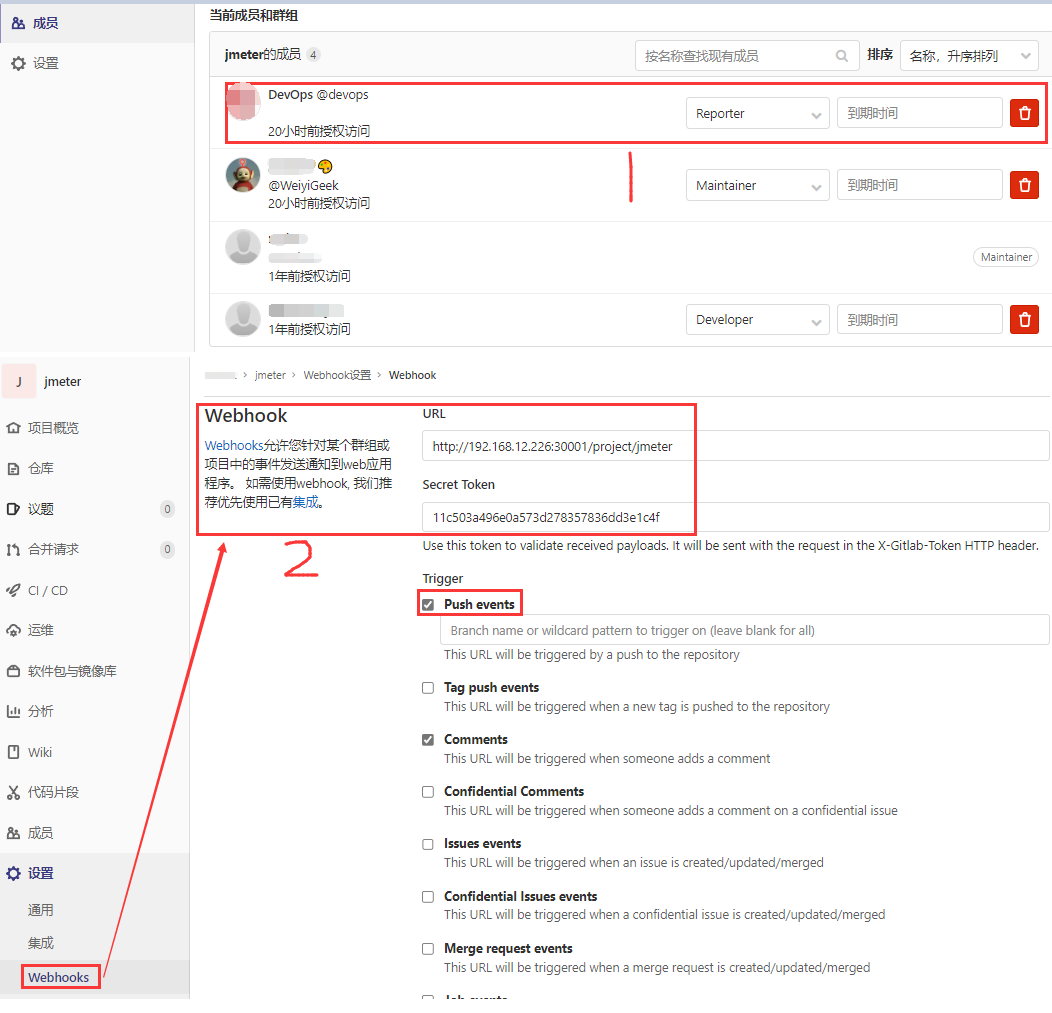
步骤 03.在 Jmeter 项目仓库中添加拥有Reporter权限的自动化CI/CD用户, 此处添加的 @devops 用户,为了能自动触发Jenkins进行部署以及压力测试,我们需要再设置 -> webhooks -> 添加 jenkins 任务 url 以及 认证 Secret Token
URL: http://192.168.12.226:30001/project/jmeter
温馨提示: 上述 Secret Token 的创建 以及Gitlab私有仓库生成项目API Access Token可以参考我的如下两篇文章。
步骤 04.在 jenkins Jmeter 任务中流水线的脚本如下:
1 2 3 4 5 6 7 8 9 10 11 12 13 14 15 16 17 18 19 20 21 22 23 24 25 26 27 28 29 30 31 32 33 34 35 36 37 38 39 40 41 42 43 44 45 46 47 48 49 50 51 52 53 54 55 56 57 58 59 60 61 62 63 64 65 66 67 68 69 70 71 72 73 74 75 76 77 78 79 80 81 82 83 84 85 86 87 88 89 90 91 92 93 94 95 96 97 98 99 100 101 102 103 104 105 106 107 108 109 110 111 112 113 114 115 116 117 118 119 120 121 122 123 124 125 126 127 128 129 130 131 132 133 134 135 136 137 138 139 140 141 142 143 144 145 146 147 148 149 150 151 152 153 154 155 156 157 158 159 160 161 162 163 164 165 166 167 168 169 170 171 172 173 174 175 176 177 178 179 180 181 182 183 184 185 186 187 188 189 190 191 192 193 194 195 196 197 198 199 200 201 202 203 204 205 206 207 208 209 210 211 212 213 214 215 216 217 218 219 220 221 222 223 224 225 226 227 228 229 230 231 232 233 234 235 236 237 238 239 240 241 242 243 244 245 246 247 248 249 250 251 252 253 254 255 256 257 258 259 260 261 262 263 264 265 266 267 268 269 270 271 272 273 274 275 276 277 278 279 280 281 282 283 284 285 286 287 288 289 290 291 292 293 294 295 296 297 298 299 300 301 302 303 304 305 306 307 308 309 310 311 312 313 314 315 316 317 318 319 320 321 322 323 324 325 326 327 328 329 330 331 332 333 334 335 336 337 338 339 340 341 342 343 344 345 346 347 348 349 350 351 352 353 354 def PRJECT = "ssh://git@gitlab.weiyigeek.top/devops/jmeter.git" def PUBKEY = "5e2f46d9-6725-4399-847f-dafb3f29d0ce" def QY_WECHAT_WEBHOOK_KEY= "ee1165c3-56c1-4bc1-8423-ecc5ccda9278" def QY_WECHAT_WEBHOOK = "https://qyapi.weixin.qq.com/cgi-bin/webhook/send?key=${QY_WECHAT_WEBHOOK_KEY}" def ENV_TEST() { def config = [:] config.K8S_API_SERVER = "https://slb-vip.k8s:16443" config.K8S_IP_SERVER = "192.168.12.110" config.K8S_CREDENTIALSID = "8cf24244-3e26-41a9-b7fe-3eb20778c33a" config.CI_NAME = "${env.JOB_NAME}" config.CI_NAMESPACE = "devtest" config.CI_ENVIRONMENT = "test" config.CI_COMMAND = '["bash"]' config.CI_STORAGE_NAME = "nfs-devtest" config.INGRESS_DOMAIN = "testapp.weiyigeek.top" config.HARBOR_URL = "harbor.weiyigeek.top/devops" config.HARBOR_AUTH = "d0ce1239-c4bf-41ed-a4c6-660ab70d9b47" return config } def ENV_PROD() { def config = [:] config.K8S_API_SERVER = "https://apiserver.cluster.weiyigeek:6443" config.K8S_IP_SERVER = "192.168.12.102" config.K8S_CREDENTIALSID = "k8s-cluster.weiyigeek-devops" config.CI_NAME = "${env.JOB_NAME}" config.CI_NAMESPACE = "devtest" config.CI_ENVIRONMENT = "prod" config.CI_COMMAND = '["bash"]' config.CI_STORAGE_NAME = "nfs-storage" config.INGRESS_DOMAIN = "test.app.weiyigeek.top" config.HARBOR_URL = "harbor.weiyigeek.top/devops" config.HARBOR_AUTH = "d0ce1239-c4bf-41ed-a4c6-660ab70d9b47" return config } def JOB_NAME = "${env.JOB_NAME}-${env.BUILD_NUMBER}" def JOB_WORKSPACE = "${env.WORKSPACE}" def GET_REAL_PROJECT(){ def PROJECT = [:] PROJECT.commitmsg=sh label: 'git_commitmsg' ,returnStdout: true , script: """ git show --oneline --ignore-all-space --text | head -n 1 |tr -d '\\n' """ if ( PROJECT.commitmsg != null ) { def arr = PROJECT.commitmsg.split(" " ) as List print arr PROJECT.JmeterNAME = arr[1 ] PROJECT.JmeterENV = arr[2 ] PROJECT.JmeterFILE = arr[3 ] PROJECT.JmeterGthreads = arr[4 ].toInteger() PROJECT.JmeterGloops = arr[5 ].toInteger() } else { unstable '提取git commit信息失败' } PROJECT.JmeterFilePath=sh label: 'JmeterFilePath' ,returnStdout: true , script: """ find ${env.WORKSPACE} -name ${PROJECT.JmeterFILE} | head -n 1 | tr -d '\n' """ print PROJECT.JmeterFilePath return PROJECT } pipeline { agent { kubernetes { cloud 'kubernetes' namespace 'devops' inheritFrom 'jenkins-slave' showRawYaml 'false' workingDir '/home/jenkins/agent' yaml """\ apiVersion: kind: Pod metadata: labels: app: 'jenkins-jnlp' job: ${JOB_NAME} spec: serviceAccountName: 'jenkins-sa' automountServiceAccountToken: false securityContext: runAsUser: 1000 # default UID of jenkins user in agent image containers: - name: 'jnlp' image: 'harbor.weiyigeek.top/devops/alpine-jenkins-jnlp:v2.330' imagePullPolicy: 'IfNotPresent' command: ["/bin/sh"] args: ["-c","/usr/local/bin/jenkins-agent.sh && cat"] tty: true env: - name: JAVA_OPTS value: '-Xms512m -Xmx1g -Xss1m' resources: limits: {} requests: memory: '512Mi' cpu: '500m' volumeMounts: - name: 'docker-socket' mountPath: '/var/run/docker.sock' volumes: - name: docker-socket hostPath: path: /var/run/docker.sock """ } } options { gitLabConnection('Private-Gitlab' ) gitlabBuilds(builds: ['代码拉取' , '压力测试' ,'结果展示' ]) timeout(time: 30 , unit: 'MINUTES' ) } environment { GITLAB_URL = "${PRJECT}" GITLAB_PUB = "${PUBKEY}" SONARQUBE_PROJECTKEY = "${JOB_NAME}" ; SONARQUBE_TIMEOUT = '60' ; } parameters { gitParameter branch: '' , branchFilter: 'origin/(.*)' , defaultValue: 'origin/master' , description: '查看构建部署可用的Tag或Branch名称?' , name: 'TagBranchName' , quickFilterEnabled: false , selectedValue: 'NONE' , sortMode: 'DESCENDING_SMART' , tagFilter: '*' , type: 'GitParameterDefinition' string(name: 'RELEASE_VERSION' , defaultValue: "master" , description: 'Message: 请选择构建部署的Tag或Branch名称?' , trim: 'True' ) choice(name: 'PREJECT_ENVIRONMENT' , choices: ['Test' , 'Test' ], description: 'Message: 选择项目部署环境?' ) choice(name: 'PREJECT_OPERATION' , choices: ['None' , 'deploy' , 'rollback' , 'redeploy' ], description: 'Message: 选择项目操作方式?' ) choice(name: 'IS_IMAGEBUILD' , choices: ['True' ,'False' ], description: 'Message: 是否进行镜像构建操作?' ) choice(name: 'IS_RELEASE' , choices: ['False' ,'True' ], description: 'Message: 是否进行编译成品发布?' ) choice(name: 'IS_SONARQUBE' , choices: ['False' ,'True' ], description: 'Message: 是否进行代码质量检测?' ) } triggers { gitlab(triggerOnPush: true , triggerOnMergeRequest: true , branchFilterType: 'All' ) } stages { stage ('代码拉取' ) { steps { timeout(time: 5 , unit: 'MINUTES' ) { script { try { checkout([$class: 'GitSCM' , branches: [[name: "${params.RELEASE_VERSION}" ]], doGenerateSubmoduleConfigurations: false , extensions: [], submoduleCfg: [], userRemoteConfigs: [[credentialsId: "${env.GITLAB_PUB}" , url: "${env.GITLAB_URL}" ]]]) updateGitlabCommitStatus name: '代码拉取' , state: 'success' } catch (Exception err) { updateGitlabCommitStatus name: '代码拉取' , state: 'failed' echo err.toString() unstable '拉取代码失败' error "[-Error] : 代码拉取失败\n [-Msg] : ${err.getMessage()} " } if ( "${env.gitlabActionType}" != "null" ) { echo "任务名称: ${JOB_NAME}, 自动触发操作: ${env.gitlabActionType}, 项目名称: ${env.gitlabSourceRepoName}, 项目地址: ${env.GITLAB_URL},项目分支:${env.gitlabBranch} - ${env.gitlabSourceBranch}" } else { echo "任务名称: ${JOB_NAME}, 手动触发操作: ${params.PREJECT_OPERATION}, 项目环境: ${env.PREJECT_ENVIRONMENT}" } project = GET_REAL_PROJECT() if ( "${project.JmeterENV}" == "cloud" ) { config = ENV_TEST() print "项目环境: ${project.JmeterENV}" } else { config = ENV_TEST() print "项目环境: ${project.JmeterENV}" } if ( "${env.gitlabActionType}" != "null" ) { sh label: 'auto message notification' , script: """\ curl ${QY_WECHAT_WEBHOOK} \ -H 'Content-Type: application/json' \ -d '{ "msgtype": "markdown", "markdown": { "content":"Jenkins-消息通知<font color=\\"info\\">【${JOB_NAME}】</font>任务开始, 自动触发! \\n >项目信息: <font color=\\"warning\\">${project.JmeterNAME} - ${env.gitlabBranch} - ${env.gitlabMergeRequestLastCommit}</font> >提交信息: <font color=\\"warning\\">${project.commitmsg}</font> >测试环境: ${project.JmeterENV} >测试任务: ${project.JmeterFILE} >线程数量: ${project.JmeterGthreads} >循环次数: ${project.JmeterGloops} >[查看当前任务流水线](${env.BUILD_URL})" } }' """ } else { sh label: 'manual message notification' , script: """\ curl ${QY_WECHAT_WEBHOOK} \ -H 'Content-Type: application/json' \ -d '{ "msgtype": "markdown", "markdown": { "content":"Jenkins-消息通知<font color=\\"info\\">【${JOB_NAME}】</font>任务开始, 手工触发! \\n >项目信息: <font color=\\"warning\\">${project.JmeterNAME} - ${params.TagBranchName}</font> >提交信息: <font color=\\"warning\\">${project.commitmsg}</font> >测试环境: ${project.JmeterENV} >测试任务: ${project.JmeterFILE} >线程数量: ${project.JmeterGthreads} >循环次数: ${project.JmeterGloops} >[查看当前任务流水线](${env.BUILD_URL})" } }' """ } } } } } stage ("压力测试" ) { when { expression { return params.PREJECT_OPERATION == "None" } } steps { script { try { withKubeConfig(caCertificate: '' , clusterName: '' , contextName: '' , credentialsId: "${config.K8S_CREDENTIALSID}" , namespace: '' , serverUrl: "${config.K8S_API_SERVER}" ) { String[] K8S_API_DOMAIN; K8S_API_DOMAIN = "${config.K8S_API_SERVER}" .split('//' ); K8S_API_DOMAIN = "${K8S_API_DOMAIN[1]}" .split(':' ); print "K8S_API_DOMAIN ->" + K8S_API_DOMAIN[0 ]; res_status=sh label: 'jmeter' ,returnStdout: true , script: """ echo "${config.K8S_IP_SERVER} ${K8S_API_DOMAIN[0]}" | sudo tee -a /etc/hosts >> /dev/null \ && kubectl get pod -n ${config.CI_NAMESPACE} -l app.kubernetes.io/instance=jmeter | grep "jmeter" | wc -l | head -n 1 |tr -d '\\n' """ if ( "${res_status}" != "0" ) { print "jmeter-distributed (master/server) = ${res_status}" def MASTER_NAME=sh label: 'MASTER_NAME' ,returnStdout: true , script: """ kubectl get pods -l app.kubernetes.io/component=master -o jsonpath='{.items[*].metadata.name}' -n ${config.CI_NAMESPACE} | tr -d '\\n' """ def SERVER_IPS=sh label: 'SERVER_IPS' ,returnStdout: true , script: """ kubectl get pods -l app.kubernetes.io/component=server -o jsonpath='{.items[*].status.podIP}' -n ${config.CI_NAMESPACE} | tr ' ' ',' |tr -d '\\n' """ print "Name: ${MASTER_NAME}\nServer_IPS: ${SERVER_IPS}" sh label: 'Jmeter-distributed' , script: """ kubectl -n ${config.CI_NAMESPACE} cp ${project.JmeterFilePath} ${MASTER_NAME}:/jmeter/${project.JmeterFILE} && \ kubectl -n ${config.CI_NAMESPACE} exec -it $MASTER_NAME -- jmeter -Ggroup.threads=${project.JmeterGthreads} -Ggroup.loops=${project.JmeterGloops} -n -t /jmeter/${project.JmeterFILE} -l ${project.JmeterFILE}.result -R $SERVER_IPS """ } else { print "jmeter-distributed (master/server) = ${res_status}" error "[-Error] : jmeter-distributed 分布式压力测试master、server环境未启动!\n " } } updateGitlabCommitStatus name: '压力测试' , state: 'success' } catch (Exception err) { echo err.toString() unstable '压力测试失败' updateGitlabCommitStatus name: '压力测试' , state: 'failed' error "[-Error] : 压力测试失败\n [-Msg] : ${err.getMessage()} " } } } } stage('结果展示' ) { when { expression { return params.PREJECT_OPERATION == "None" } } steps { script { try { sh label: 'grafana-jmeter-dashboard' ,script: """ curl -s ${QY_WECHAT_WEBHOOK} \ -H 'Content-Type: application/json' \ -d '{ "msgtype": "markdown", "markdown": { "content":"Jenkins-消息通知<font color=\\"info\\">【${JOB_NAME}】</font> - ${project.JmeterFILE} 任务压力测试完毕 !^_^\\n >图形访问地址: <font color=\\"warning\\">[https://devops.weiyigeek.top/grafana/d/p6hnPpg4z/apache-jmeter-dashboard?from=now-5m&to=now](https://devops.weiyigeek.top/grafana/d/p6hnPpg4z/apache-jmeter-dashboard?from=now-5m&to=now)</font> >[查看当前任务流水线](${env.BUILD_URL})" } }' """ updateGitlabCommitStatus name: '结果展示' , state: 'success' } catch (Exception err) { updateGitlabCommitStatus name: '结果展示' , state: 'failed' echo err.toString() } } } } } post { always { deleteDir() } success { echo "Pipeline ${env.JOB_NAME} 项目成功 ^_^" qyWechatNotification failNotify: true , webhookUrl: "https://qyapi.weixin.qq.com/cgi-bin/webhook/send?key=${QY_WECHAT_WEBHOOK_KEY}" } unstable { echo "Pipeline ${env.JOB_NAME} 项目不稳定 :/" qyWechatNotification failNotify: true , webhookUrl: "https://qyapi.weixin.qq.com/cgi-bin/webhook/send?key=${QY_WECHAT_WEBHOOK_KEY}" } failure { echo "Pipeline ${env.JOB_NAME} 项目失败 :(" qyWechatNotification failNotify: true , webhookUrl: "https://qyapi.weixin.qq.com/cgi-bin/webhook/send?key=${QY_WECHAT_WEBHOOK_KEY}" } changed { echo "Pipeline ${env.JOB_NAME} 项目改变 .-." qyWechatNotification failNotify: true , webhookUrl: "https://qyapi.weixin.qq.com/cgi-bin/webhook/send?key=${QY_WECHAT_WEBHOOK_KEY}" } } }
温馨提示: 上述使用 Jenkins 自定义 jnlp-Slave 镜像 weiyigeek/alpine-jenkins-jnlp,如需自行构建可以参考如下地址https://hub.docker.com/r/weiyigeek/alpine-jenkins-jnlp
温馨提示: 此处在 jenkins 中使用 kubernetes-plugins 插件以便在 kubernetes Cloud 集群中动态生成 Slave Pod , 参考地址: https://blog.weiyigeek.top/2020/12-30-531.html#3-集群动态创建-Agent-节点-Slave-节点 。
温馨提示: 上述 webhook 消息通知是采用了企业微信群机器人 qy-wechat-notification-plugin 插件 https://blog.weiyigeek.top/2020/12-31-537.html#4-qy-wechat-notification-plugin ,当然你也可以将其换为阿里钉钉通知,主要看你企业中是使用哪一个作为你的通知使用。
步骤 05.在前面的环境都准备好的情况下,我们便可以上传jmeter任务jmx格式的文件到gitlab仓库中,然后配置的webhook将会自动触发Jenkins任务从而进行自动化压力测试,此处我们先来看自动触发。
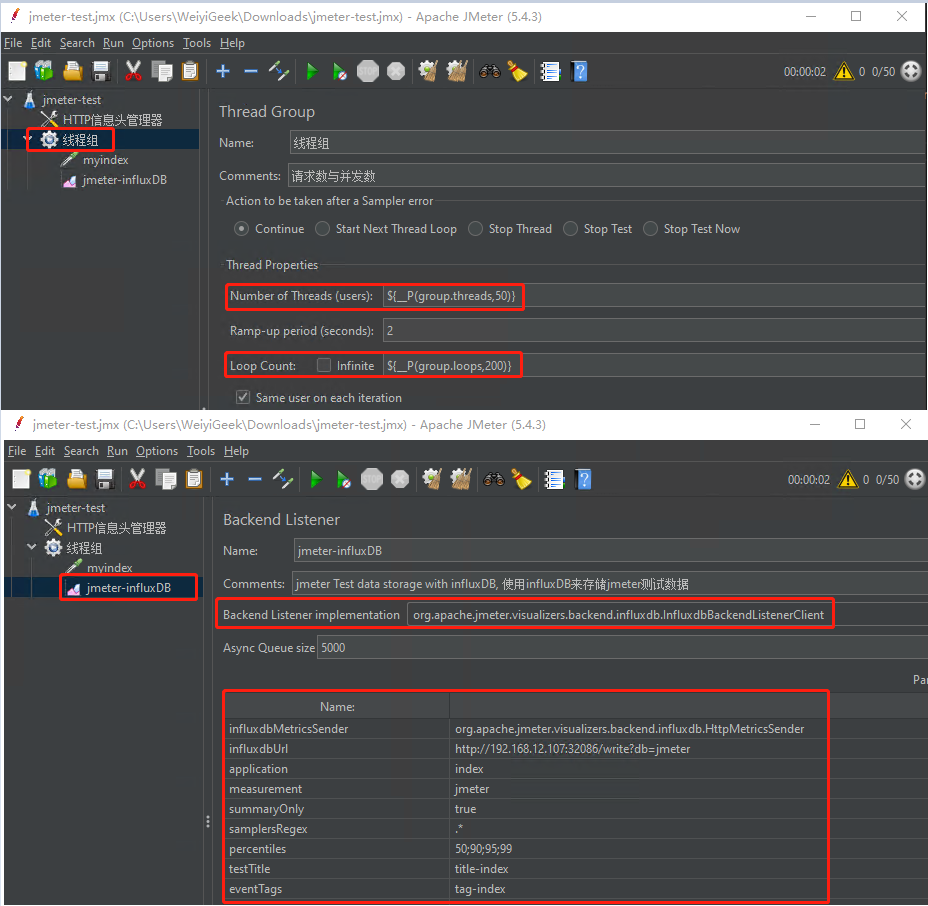
1.我们需要先创建一个 jmeter 带线程组的任务,在Thread Properties中分别在Number of Threads 、 Loop Count 配置为 ${__P(group.threads,50)} 和 ${__P(group.loops,200)}
2.然后在 jmeter 带线程组的任务, 右键新增一个 Backend Listner 其关键点如下所示:
1 2 3 4 5 6 7 8 9 10 11 12 13 14 15 16 17 18 influxdbMetricsSender: org.apache.jmeter.visualizers.backend.influxdb.HttpMetricsSender influxdbUrl: http://192.168.12.107:32086/write?db=jmeter application: index measurement jmeter summaryOnly true samplersRegex .* percentiles 50;90;95;99 testTitle title-index eventTags tag-index
weiyigeek.top-Backend Listner
步骤 06.此处我使用 git 将 jmeter 项目克隆到本地中, 然后将上面的jmeter任务进行导出,并且复制 jmeter-test.jmx 到本地E:\githubProject\jmeter 目录之中,通过 git 三步法将更改提交到Gitlab仓库中。
1 2 3 4 5 6 7 git clone ssh://git@gitlab.weiyigeek.top:2222/devops/jmeter.git cd E:\githubProject\jmetercopy C:\Users\WeiyiGeek\Downloads\jmeter-test.jmx E:\githubProject\jmeter $ git add . $ git commit -m "jmeter weiyigeek jmeter-test.jmx 50 100" $ git push
温馨提示:此处我已经将ssh公钥添加到gitlab中了, 后续拉取和推送代码到私有仓库更加方便。
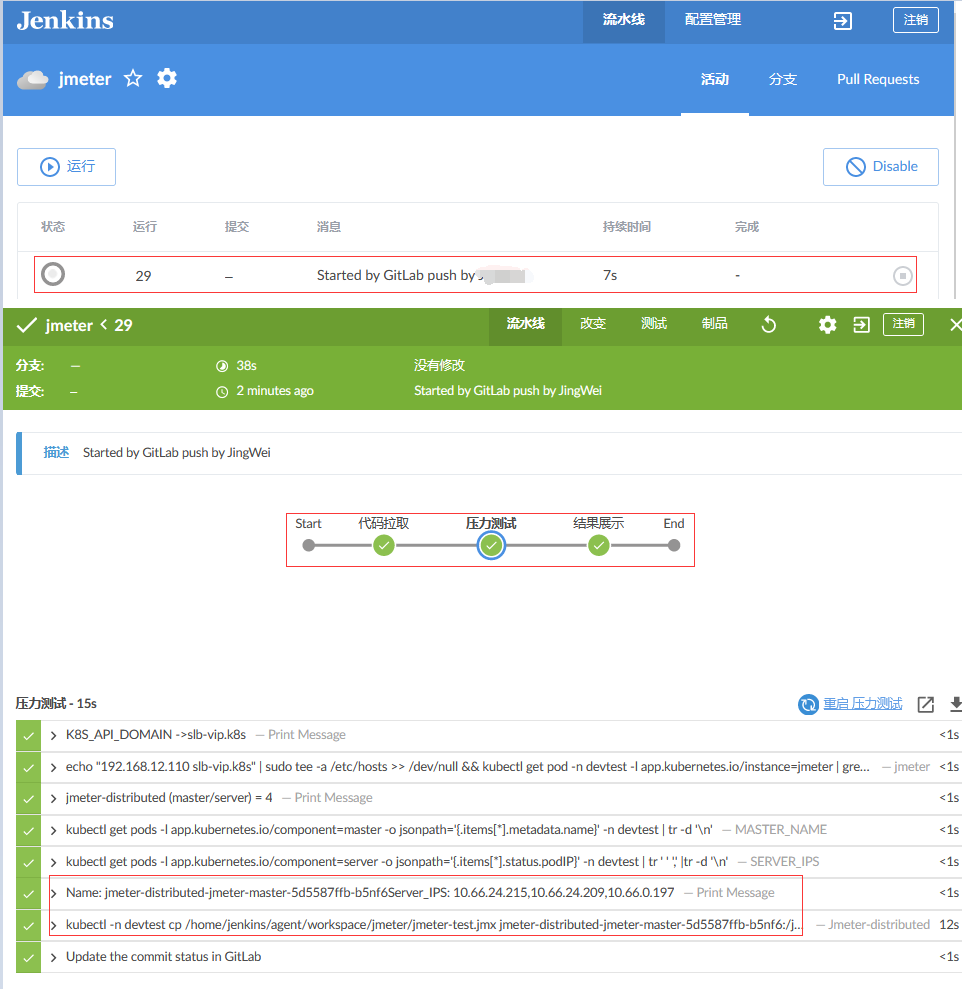
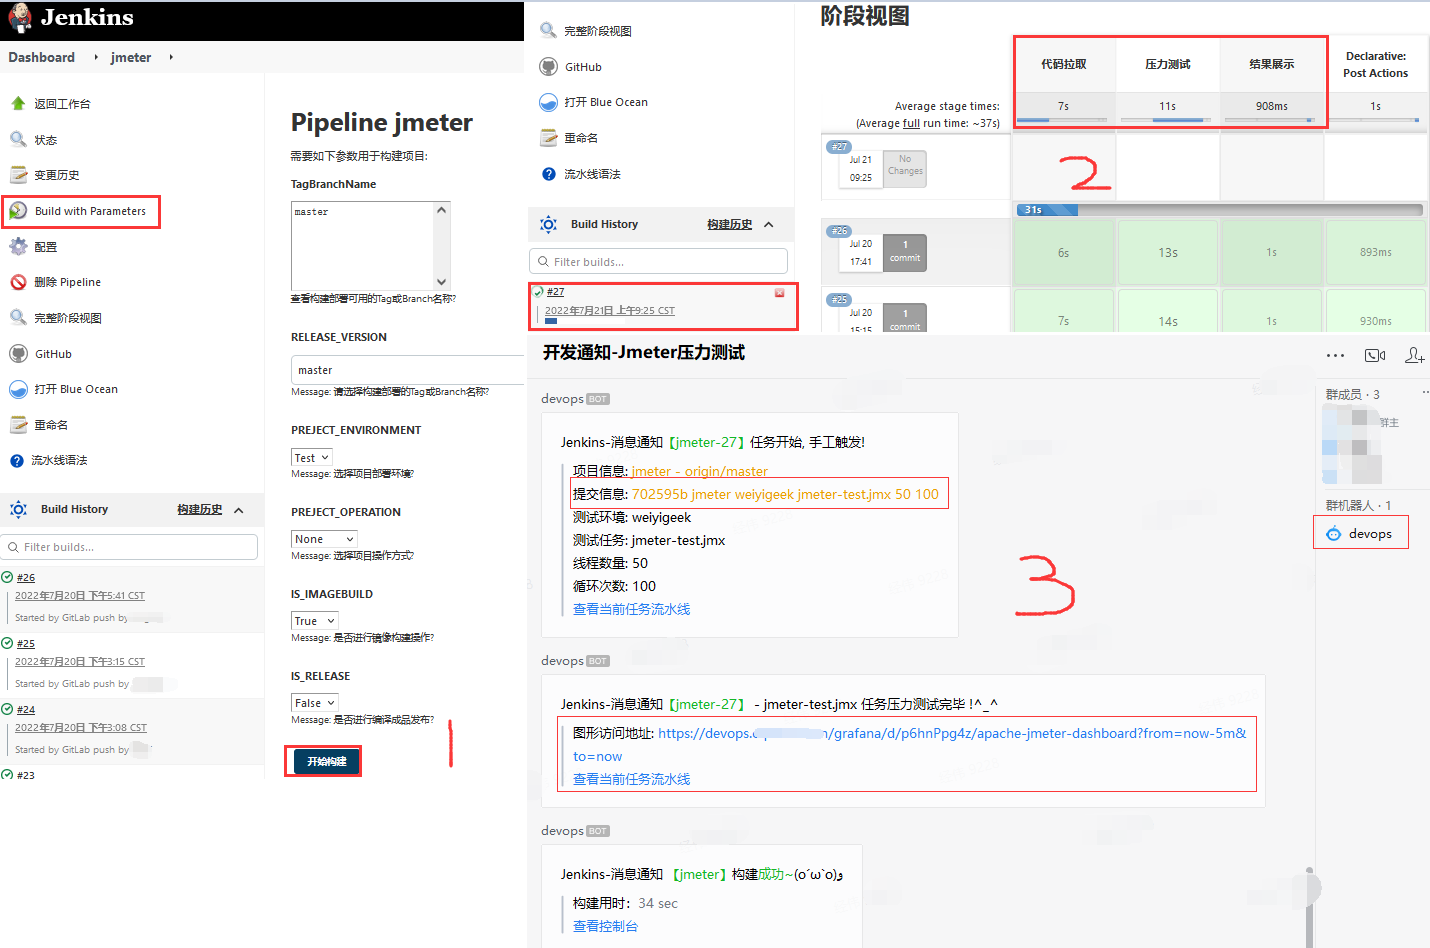
步骤 07.在 Jenkins 中可以查看到 Started by GitLab push by WeiyiGeek 自动触发字样, 并且在 blueocean 插件界面下可以看到流水线执行的情况。
1 2 + kubectl -n devtest cp /home/jenkins/agent/workspace/jmeter/jmeter-test.jmx jmeter-distributed-jmeter-master-5d5587ffb-b5nf6:/jmeter/jmeter-test.jmx + kubectl -n devtest exec -it jmeter-distributed-jmeter-master-5d5587ffb-b5nf6 -- jmeter '-Ggroup.threads=50' '-Ggroup.loops=100' -n -t /jmeter/jmeter-test.jmx -l jmeter-test.jmx.result -R 10.66.24.215,10.66.24.209,10.66.0.197
weiyigeek.top-Jenkins pipeline & blueocean
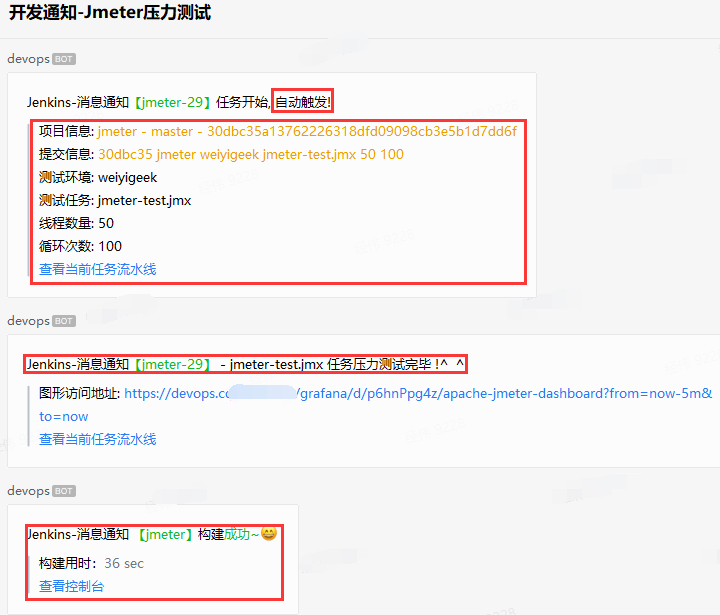
步骤 08.上述 Jenkins pipeline 流水线执行完毕之后,可以从企业微信中查看到 jmeter 任务相关通知
weiyigeek.top-qywechat notification
步骤 09.点击企业微信中展示压力测试数据的 Grafana dashboard 地址,查看jmeter压力测试的相关数据。
weiyigeek.top-Grafana & jmeter
步骤 10.上述提供的Jenkins流水线中除了通过Gitlab代码仓库更新自动触发外,我们还可以进行手动触发进行jmeter自动化压力测试,我们在Jenkins Dashboard 中点击 jmeter -> Build With Parameters -> 此处我只有一个默认分支所以,其参数缺省即可(请注意脚本中的ENV_TEST()函数) -> 点击开始构建, 完成后将如下图所示。
weiyigeek.top-手动触发Jmeter压力测试
至此在在Kubernetes集群中进行jmeter + InfluxDB + gitlab + Jenkins进行自动化jmeter分布式压力测试实践完毕!.
0x03 在Kubernetes集群(jmeter + InfluxDB 2.x + Grafana)中进行自动化分布式压力测试及结果展示 描述: 如果要使用最新 jmeter dashboard 模板,我们需要将 InfluxDB 版本切换为 2.x 并且分布式压力测试 jmeter 程序需要运行在 JDK 11 以上。
温馨提示: Java SE Development Kit 11.0.15.1 (Java SE 订阅者将至少在 2026 年 9 月之前收到 JDK 11 更新), 下载地址 https://www.oracle.com/java/technologies/downloads/#java11
1 2 3 4 5 6 7 8 9 10 11 systeminfo java --version jmeter.bat
(1) 以 helm 方式安装InfluxDB 2.x 时序数据库 快速安装 1 2 3 4 5 6 7 8 9 10 11 12 13 14 15 16 17 18 19 20 21 22 23 24 25 26 27 28 29 30 31 32 33 34 35 36 37 38 39 40 41 42 43 44 45 46 47 48 49 50 51 52 53 helm repo add bitnami https://charts.bitnami.com/bitnami helm repo update && helm search repo influxdb helm show values bitnami/influxdb > influxdb.yml helm install jmeter-influxdb2 bitnami/influxdb -f influxdb.yml --version 5.3.1 -n devtest --debug --create-namespace kubectl get pod -n devtest jmeter-influxdb2-5574c9c4c9-bzx4l jmeter- kubectl exec -it -n devtest jmeter-influxdb2-5574c9c4c9-bzx4l -- bash I have no name!@jmeter-influxdb2-5574c9c4c9-bzx4l:/$ env | egrep "^INFLUXDB_" INFLUXDB_ADMIN_USER_TOKEN=9ONq6UdzvEtMRny40uUN INFLUXDB_ADMIN_ORG=primary INFLUXDB_CREATE_USER_TOKEN=no INFLUXDB_ADMIN_USER=admin INFLUXDB_HTTP_AUTH_ENABLED=true INFLUXDB_ADMIN_BUCKET=primary INFLUXDB_ADMIN_USER_PASSWORD=fL2JnkqExH influx org create -n jmeter -d "jmeter organization" -t 9ONq6UdzvEtMRny40uUN influx bucket create -n jmeter -r 0 -o jmeter -t 9ONq6UdzvEtMRny40uUN influx user create --name jmeter --password weiyigeek.top --org jmeter -t 9ONq6UdzvEtMRny40uUN influx auth create --user jmeter --org jmeter --all-access -t 9ONq6UdzvEtMRny40uUN influx v1 dbrp create --db jmeter_db --rp jmeter_rp --bucket-id ba47a04e75fb2e05 --org jmeter --default -t 9ONq6UdzvEtMRny40uUN kubectl port-forward --namespace devtest --address 0.0.0.0 $(kubectl get pods --namespace devtest -l app.kubernetes.io/name=influxdb -o jsonpath='{ .items[0].metadata.name }' ) 30086:8086
0x0n 附录参考 Jmeter Backend Listener 组件介绍
Jmeter 插件安装 描述: 存放插件jar目录的为D:\Tools\apache-jmeter-5.4.3\lib\ext,我们可以将jar文件将其放在/lib/ext中,重启Jmeter就可以了。
Prometheus Listener for Jmeter (为Prometheus导出JMeter指标), 利用它就能将 JMeter 变成一个 Data Exporter 然后在使用 Prometheus 进行抓取。